

Science Aid Center... Genomics Core
Submit your corrections or suggestions for new SACK's (Science Aid Center Knowledge) by emailing the Genomics Core. Comments on protocol tips and resources are also encouraged.Note: All pdf documents below are original vendor documents and were not designed for use with screen reader applications.
Genomics Core SACK's
DNA Sequencing SACK's
Fragment Analysis (FA) SACK's
Hodgepodge SACK's
Website
- Which website pages require a Login ID?
- How do I obtain a Login ID?
- How do I change my Password?
- Best Device & Browser for this website?
Core
- What can I do in the Core without a Login ID?
- What supplies does the Core stock?
- How to improve Air Quality in your lab?
- What is the BioSci Thrift Store?
Public(ation) embarrassment
- Coping with the editorial process.
- How can I avoid publishing embarrassing data?
- Why don't electropherogram peaks always = good data?
Miscellaneous
Template
- PCR product: clone, or directly sequence?
- Small PCR products: how to sequence?
- Can I directly sequence genomic DNA?
- How to achieve better cloning results?
- How to avoid multiple signals?
- Is it essential to clean PCR products for sequencing?
- How to clean DNA template for sequencing?
- How much DNA to use in a sequencing reaction?
- Estimate template input by agarose gels.
- Why are Spectrophotometers "Bad", and what to do instead?
- How to interpret 260/230 & 260/280 OD ratios?
- Should I use a Nanodrop to quantitate DNA?
- Nanodrop Guide for Nucleic Acids (ThermoFisher)?
- Nanodrop Guide for Protein (ThermoFisher)?
- Epic Nanodrop Fail (ouch!)
Primer
- Choice of primer resuspension buffer?
- Concentration for storage & working stocks of primers?
- How much primer to use for sequencing reactions?
- How many primers per sequencing reaction?
- Can I use my PCR primers for sequencing?
- 'Plasmid' or 'PCR' primer for sequencing?
- Annealing temperature for sequencing?
- Why does my primer give multiple signals?
- Primer availability and requirements at the Genomics Core?
Buffer
- Why is a buffer necessary for sequencing?
- How much do I save by replacing BigDye with Buffer?
- Do 'home-made' & ABI versions differ in performance?
- What is the buffer's composition?
- How much buffer do I use?
- What should my final buffer concentration be?
BigDye Terminator mix v3.1
- What is the maximum "Ramp Rate" for BigDye?
- Why is BigDye Terminator mix v3.1 required?
- How many times can BigDye be frozen/thawed?
- Why aliquot original tube of BigDye Terminator mix v3.1?
- How much BigDye should I use?
- Why vortex BigDye vigorously?
Sequencing reaction
- How to prepare my sequencing reactions?
- What is the standard PCR sequencing protocol?
- How to sequence difficult DNA templates?
- Why include positive controls?
- How to set up my positive controls?
- Why does sample location in a 96-well plate matter?
- Can advance planning achieve more rapid results?
- Can I reuse plates (tubes) for sequencing?
Post-sequencing reaction
- How to clean sequenced templates?
- EDTA vs. sodium acetate for DNA precipitation?
- 'Dump-&-Blot', pipette, or 'spin-out' ethanol?
- How to resuspend cleaned, sequenced templates?
- When to resuspend in water vs. formamide?
- What kind of formamide should I use?
- Why keep formamide 'dry'?
- Why restrict freeze-thaw cycles for formamide?
Submitting samples
- How to submit samples to Genomics Core?
- Which format – tubes or 96-well plates?
- Which 96-well plates are acceptable?
- May I cut my 96-well plates to a smaller size?
- Why 0.2 ml tubes (vs. larger tubes)?
- Why leave blank wells empty?
- What can blank wells have contained previously?
- How to seal my finished plates or tubes?
- Rapid sequencing results?
Data analysis
- How long does it take to obtain my sequence data?
- How do I obtain my sequence data?
- How do I analyze my data?
- Why analyze data with Sequence Scanner?
- Why reanalyze my data with Sequencing Analysis v5.2?
- Suppose I believe my bad data is the Core's fault?
Troubleshooting
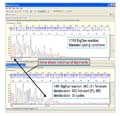
- Why did signal intensity soar, then plummet (at ~150 bp)?
- Why did the baselines separate (raw signal view)?
- What causes a low-level signal after the PCR-stop?
- Why does signal intensity differ between capillaries on an array or different 3130xl’s?
- Why do massive peaks occur ~50-70 bp into my data?
- Why did my sequence become 'trash' immediately after a pure poly-'singlebase' region?
- Why is the beginning of my sequence 'trash'?
- Why am I suddenly getting poor quality Sequencing Reactions?
- Why did my samples show "delayed migration"?
- Why did my plasmid sequencing fail?
- Where can I find more trouble-shooting information?
Fragment Analysis: Services & Comments
Fragment Analysis: Sample Preparation
Fragment Analysis: Troubleshooting
The 'Dark Side'
RNA & DNA extraction
Gel electrophoresis
- TBE buffer: '1X' versus '0.5X'?
- Buffers: 'Sodium Borate' versus TBE (or TAE)?
- Can I reuse my agarose gels and electrophoresis buffer?
qPCR
- qPCR instrument block type?
- Choice of qPCR plates and seals?
- “Cradle-to-Grave” plate protection
- Cold-Reaction Setup
- Applying Optical Adhesive Seals
Ethanol preparation & storage
- Relevance of "Miscibility" & "Packing"?
- Why not "top off" to make 70% Ethanol?
- How to minimize effects of humidity on Ethanol?
- Do I need to use Ethanol "cold"?
- Do I need to make fresh 70% Ethanol daily?
Nanodrop (DNA & Protein)
- Nanodrop Guide for Nucleic Acids (ThermoFisher)
- Nanodrop Guide for Protein (ThermoFisher)
- Epic Nanodrop Fail
- NanoDrop Quick Tips
Agilent Bioanalyzer DNA-HS Chip
- Mastering the Bioanalyzer DNA-HS Chip assay
- Loading Agilent Bioanalyzer chips... Genomics Core style!
Agilent Bioanalyzer RNA Pico 6000 Chip
- Tips for preparing and loading RNA Pico 6000 chips (Agilent Bioanalyzer)
- Hidden Breaks (28S RNA peak)
Website
Which website pages require a Login ID?
With a Login ID, you can access the following pages:How do I obtain a Login ID?
Click on the 'Login' navigation bar, and then click on 'Request a Login'. A mail form will appear; follow the instructions at the bottom of the page, and submit the completed form. If your PI (i.e., major professor) has previously submitted samples for sequencing (or requested supplies), you will receive an email shortly (typically, by the next business day) with your Login ID. Otherwise, you will receive an email noting that you and your PI must first visit the Core so that we can acquaint you with certain procedures. In that case, you will receive a Login ID following the conclusion of that meeting.How do I change my Password?
Login to the website, click on the 'Personal Information' navigation bar, click on 'Change Password', complete the form, and submit the form. Your new Password will be available immediately.Best Device & Browser for this website?
By far, this website is best viewed and navigated on a standard Computer (10-inch monitor, minimum) and it was developed to work optimally with Chrome. The site relies heavily on PHP and standard HTML, but it does use some other coding types as well (e.g., javascript). Unfortunately, resource limitations make it impossible for us to design the site to be fully cross-compatible with all device types and browsers; however, if you have coding suggestions for improving the website in that respect, please email them to the Genomics Core for our consideration.Core
What can I do in the Core without a Login ID?
You may access any website information that is not controlled by a 'Login ID'; further, you may consult with us regarding experiments which are related to the Core's primary mission. Finally, after completing any required training, you may use the following equipment:What supplies does the Core stock?
For current "in-stock" listings, please see our Reagents & Supplies webpage. Suggestions are welcome; if there is a high demand for a particular product, we may consider stocking it. In many cases, even if we need to place a special order, it will cost your lab less to 'shop' here rather than directly with the vendor.How to improve Air Quality in your lab?
Previously, we had to continually clean the laser-based instruments in our lab. After an ABI service engineer suggested that the incoming air (from the A/C system) must be dirty, we measured particle counts (with a hand-held monitor) at various points in the lab and in the hallway. Above 5.0 µM, the air was very clean (virtually zero counts); however, below 5.0 µM, particle levels skyrocketed ... particularly when we monitored the air flowing directly out of the ducts.We placed 20X20 Filtrete 1900 MPR filters (1") above the grills (20.5" X 20.5") covering the ducts, taking care to seal (with packing tape) the outside rim of the grills so that the incoming air could not easily bypass the filter. In comparison to incoming air in an adjacent lab (without filters) or even in the hallway, counts from the filtered ducts dropped precipitously for very small particles (≥0.5 µM) and substantially for extremely small particles (0.3 µM) – even though both doors to the lab are left open all day.
Filtered air (Particle counts Filter.xlsx) in A628 was actually cleaner than the air at instrument-level (Typhoon and ABI 3130xl's); however, the air in our room was still much cleaner than the air in the hallway or in the adjacent lab (A653). Basically, although positive outflow of air from the room limits intrusion by hallway air, lab activities and entries by personnel keep some particles airborne. Nevertheless, filtering the air greatly minimized the need to clean the laser-based instruments.
However, particle loads were so high that the filters became filthy in <30 days. As the 1900 MPR filter is expensive (~$20), we then examined options for increasing its longevity by capturing the larger particles before the air passed through the 1900 MPR filter. Reusable filters – even high-quality ones – removed very few of these small particles. Thus, we began installing Filtrete 1085 MPR filters (~$12) on top of the 1900 MPR filters.
The strategy worked, such that we could replace filters only about every 2-3 months; however, LSU stated that the 'double-filter' placed too much back-pressure on the air handling system. In the end, we decided to install single 1900 MPR filters and replace them about every 3 months. Up to ~3 months, very little dust actually bypassed the filters (even though they were thoroughly black in 30 days), as could be monitored by the near absence of dust on the laboratory benches over the 3 months.
What is the BioSci Thrift Store?
Listings may include free items (scientific or personal), discounted items (Genomics Core, GC), departmental items for trade, items left by mistake in the Core, and housing.For further details, see the BioSci Thrift Store webpage. Finally, please note that the Core does
Public(ation) embarrassment
Coping with the editorial process.
Grossman, G. D., 2017. Coping with the editorial process – considerations for early–career biologists (pdf). Animal Biodiversity and Conservation, 40.2: 269–276. This essay is full of excellent advice for authors on coping with the editorial review process. While published in Animal Biodiversity and Conservation, the comments are universally applicable to dealing with both editors and reviewers. The essay also contains perspectives worthy of consideration by journal editors as well as by anyone who agrees to serve as a reviewer.Abstract: In this essay I describe aspects of the interactions between authors, reviewers and editors with the goal of helping early–career biologists navigate the publication process. Multiple authors and editors have commented on the current difficulties of obtaining quality referees for manuscript reviews, and as a consequence, the frequencies of rejections based on uninformed or erroneous reviews, may be increasing. I suggest a variety of strategies for dealing with: 1) manuscript rejections by editors without review, 2) editors who report but do not comment on reviewer comments, 3) reviews that appear to be uninformed or idiosyncratic, and 4) comments suggesting stylistic revisions rather than substantive ones. The key to any successful strategy for dealing with editors and referees involves ensuring the interaction remains civil and retains a high level of objectivity regarding criticism. In addition, the specific strategies that an author uses to respond to stylistic and substantive editorial comments will depend on their experience and perhaps, reputation in the field. The techniques suggested herein should serve to stimulate discussion of some problems in our field and also increase the probability of acceptance of a worthy manuscript submitted for publication.
How can I avoid publishing embarrassing data?
With respect to DNA sequences, you should always examine your new data with Sequence Scanner (see Software links) before beginning any analyses. This program allows you to verify signal intensities, examine the raw signal, check for bad capillaries, and much more. See Why analyze data with Sequence Scanner? for further information. As for other potentially embarrassing issues, you're on your own!Why don't peaks in electropherogram always equal good data?
During analysis, the KB caller on the 3130xl's standardizes the peaks in the analyzed sequence by rescaling them. As such, if the KB caller can tease out any information from your sequenced product, you will see 'peaks' in the electropherogram; further, the peak heights at the start of a weak sequence will be just as high as at the start of a strong sequence. See "How can I avoid publishing embarrassing data? for further information.It is not unusual to eventually discover that what appeared to be good sequence data (based on the electropherogram) was actually
Miscellaneous
Other information 'gold mines' on this website?
1) Documents for Equipment & Protocols provides links to several helpful documents (e.g., Sequencing Flowchart, Sequencing Instructions; and EtOH Precipitation).2) Services is also useful.
3) Additional Links is a treasure trove of links to sites for:
(a) Software for DNA Analysis,
(b) Quantitative and Real-time PCR websites, and
(c) sources for technical information, links, and training.
Template
PCR product: clone, or directly sequence?
Cloning PCR products is both expensive and time consuming. Further, if you are concerned that bases at certain positions in the sequence might be heterozygous within an individual, you will have to sequence ~7-8 clones to ensure capturing that information with cloned product; with direct sequencing, such heterozygosity will usually be visible as two overlapping peaks that are roughly ½ as high as surrounding peaks. Nevertheless, sometimes the data cannot be obtained without cloning. See "Other information 'gold mines' on this website? for further information.a) Single-product: Try direct sequencing of purified PCR product (by commercial columns, standard ethanol precipitation, or ExoSap) when the sample runs as a clean, single band in an agarose gel (typically 0.8 - 3.0%, depending on fragment size).
b) Multiple bands: Try direct sequencing of gel-purified PCR product when the sample runs as a clean band amongst other bands in an agarose gel.
c) 'Single-base' regions: If you know that your sequence contains a pure poly-'singlebase' region (>8-10 bases), either clone the product or try direct sequencing in both directions. (Due to strand-slippage during the original PCR, sequence data becomes unreadable after the pure-base region.)
d) Go with Plasmids: With purified plasmid DNA, stretches of pure poly-“single-base” regions(e.g., < ~35-45 bases) are not a problem. Also, plasmids ease sequencing for microsatellite regions.
Small PCR products: how to sequence?
It is certainly possible to direct sequence very short PCR products; however, doing so can be problematic. First, it’s important to keep in mind that, due to the need for 1-nt resolution, the base-called read will not start immediately after the end of your sequencing primer. In fact, under the best of circumstances, you are going to lose at least the first 5-10 nt after the primer. Ultimately, this is not a problemHowever, there are at least three other sequencing reaction factors which also create issues.
- Primer-Dimers: Typically, primer-dimers generate ~20-30 poorly-resolved intense peaks, which naturally overlap with the peaks of any target sequence, making that portion of the target read useless.
- Unincorporated Dye Terminators (UDTs): If the UDTs are not either consumed by creating sequenced fragments or adequately removed by the reaction cleanup, they appear as massive peaks at ~70-bp into the base-called read and may obscure the real peaks. In cases where longer reads are involved, samples with extremely high levels of UDTs (post-cleanup) will have additional UDT peaks later in the sequence (~50-bp apart) of steadily decreasing intensity.
- Non-target templates: When PCR products are very short, it can be extremely difficult or impossible to remove non-specific fragments (or primer-dimers) from the sample through gel purification. Even with a 3% or 4% agarose gel, it may be difficult to adequately separate the true target band from any non-specific targets of a similar size.
First, although the majority of same-sized fragments basically migrate together as a band in a gel, fragments of all sizes in the sample are actually present throughout the gel lane. Thus, even under the best of circumstances, gel-purified products will not be entirely pure (even though the impurities won’t actually matter in those ‘best’ cases). Here, though, the lack of good band separation makes the situation much worse and there are likely to be high levels of non-target templates even in a gel-purified sample... leading to poor quality reads.
Of course, you could get better resolution with polyacryamide gels; however, the typical DNA Gel-Extraction kits rely on agarose gels... so, you probably would need to resort to manual methods of extracting the DNA from the polyacrylamide gel slice. (It’s also important to minimize exposure to UV so as to minimize nicking of the target DNA.)
PCR Primer Titrations: A very simple approach is run a set of test reactions using serially-diluted primers. This primer-titration approach is likely to eliminate primer-dimers (by minimizing the probability of primers coming into contact with each other) unless the primers are simply a very poor design that promotes dimerization. It will also minimize or eliminate non-target priming, unless the primers simply match the non-targets as well as they do the targets. Thus, as primer concentrations fall, although the target band will become ever weaker, it will do so less rapidly than will occur for primer-dimers or non-specific products.
Ideally, at some point, the target band (using ~3-5 ul in the gel well) will be distinctly visible (but not very bright) and there will not be any visible primer-dimers or other non-specific products. In that case, purify those PCR products and then use the equivalent of 3-5 ul of the original PCR products to perform DNA sequencing.
Now, there are also some Sequencing Reaction options that may be useful for very short fragments.
- Residual primers: Even cleaned PCR products may contain residual primers from the original reaction; to help offset residual primers, use 1 ul of sequencing primer at 10-20 uM (vs. 2-5 uM).
- BigDye: Normal levels of BigDye (e.g., 0.5 ul in a 10 ul reaction) can cause two problems with very short templates.
>> First, very short templates don’t consume as much of the dye terminators as do long products. Thus, when cleaning the completed reactions, it may be difficult to remove enough of the UDTs simply because so many remain.
>> Second, if the target is very short, the standard amount of BigDye can create excessive signal intensity because the polymerase can quickly move to additional templates. Excessive signal can cause problems with basecalling.
>> Frankly, even as little as 0.1 ul of BigDye can generate acceptable signal intensities for products shorter than ~500-bp, so there is a lot of room to reduce the BigDye for sequencing of very short templates. - EtOH-EDTA precipitation protocol: Normally, for cleaning completed DNA sequencing reactions, we set the precipitation spin time to 20 min (@ 2500 rcf). However, for very short fragment sequencing, increasing the centrifugation time to 30 min can help to pellet the very smallest fragments... gaining perhaps an additional 5-10 nt of early sequence.
Can I directly sequence genomic DNA?
Typically, direct sequencing of genomic DNA is not done because the ratio of non-target DNA to target DNA is very high. However, we have had success in this regard with a bacterial genome. Thus, if you need sequence data from a small genome (e.g., bacterial or viral), and you cannot obtain the data by traditional means (e.g., performing PCR and sequencing the product), we will attempt to directly sequence the genomic DNA for you.By contrast, when dealing with larger genomes, the ratio of non-target DNA mass to target DNA is too extreme to allow for direct sequencing of genomic DNA. Simply put, to provide sufficient copies of the target DNA for the sequencing reaction, total template input must be ultra-high. Success under that condition would require optimization of multiple parameters of the sequencing reaction, large amounts of BigDye (to drive the reaction), and extraordinarily clean templates (to minimize background noise). Even if possible, such reactions would be extremely expensive.
How to achieve better cloning results?
Both 'sample-to-sample' and 'experiment-to-experiment' consistency are improved if you:a) Minimize variation: keep bacterial growth periods and processed volumes consistent.
b) Minimize growth time: yields better quality DNA and better sequencing results.
Overnight growth at 37oC (i.e., ~14 hours ) can produce cultures with so many cells that they 'overwhelm' the capacity of commercial purification columns. Further, it results in cells that are in late log phase/early stationary phase in which not all of the genomic DNA is intact and conjugated to cell wall.
By contrast, overnight growth at 30oC or limited growth at 37oC (i.e., 5 - 8 hours) tends to produce better quality DNA from minipreps than does standard overnight growth at 37oC. Finally, sequencing results are often better if purified by 'midi' preps rather than by miniprep-size columns.
How to avoid multiple signals?
Most commonly, multiple signals in your sequence data will arise from the existence of multiple templates in the sequencing reaction (although occasionally the sequencing primer will find more than one suitable location on the template). See also What causes a low-level signal after the PCR-stop? for another possibility.a) Cloned DNA: Either there are multiple copies of a vector (containing different inserts) within the same cell, or you failed to pick a clean, single colony. When the inserts are of different sizes, both problems can be be avoided by testing cloned DNA with standard PCR.
Your chances of a clean colony pick are enhanced by picking colonies when they are just barely big enough to be visible, such that they are still well separated. Further, examining the colonies under a low-power scope will reveal cases in which one apparent colony was actually generated by two adjacent cells (colony shape will be 'dumb-bell' like, rather than circular). Picking colonies early also ensures that there has not been sufficient time for the satellite colonies (i.e., those lacking the antibiotic-resistance gene from the insert) to grow next to the 'real' colonies. Typically, the antibiotic simply prevents growth by the bacteria; thus, once antibiotic-resistant colonies begin to exude (on plates or in a broth) compounds that neutralize the antibiotic, the bacteria from satellite colonies will begin to grow — as such, their inserts will also be harvested when the DNA is extracted. If sequencing is done with vector primers, there will be a double-signal; if done with insert primers, the signal might be weaker than expected.
b) PCR products: Typically, the existence of multiple PCR products in a reaction are apparent from a simple agarose gel experiment; in that case, you need to at least gel-purify the DNA. However, sometimes even a single, clean band is actually composed of multiple PCR products; in that case (which you will discover through sequencing), you need to clone the DNA first.
c) Primer issue: If your primer has degraded on the 5'-end or was manufactured with "n-1" (or more) nts (which would omit nts on the 5'-end of the primer due to the way primers are synthesized), it will generate templates which will be 'frame-shifted' on the DNA sequencer.
Is it essential to clean PCR products for sequencing?
Aside from removing potential contaminants that might shut down a sequencing reaction, the purpose of cleaning the PCR product is to remove the original primers and other PCR reagents. Ideally, cleaned templates should be resuspended in a low TE buffer (e.g., TVLE, 10 mM Tris, 0.05 mM EDTA pH 8); alternatively, they can be resuspended in nuclease-free water — however, the issues noted in Choice of primer resuspension buffer? apply to templates as well.Nevertheless, while purification of the PCR products is highly recommended, it might not be essential. For instance, if the PCR product is sufficiently diluted, sequencing can be successful without first cleaning the PCR product. It is particularly important that the original PCR primers are diluted to the point that they will not generate noticeable levels of sequenced product – otherwise, the original primers will introduce noise into the signal. Determining the required level of dilution is an empirical process. In addition to diluting the PCR product, you can use kits (e.g., ExoSAP-IT™) to eliminate the original PCR reagents. Both approaches have been used successfully with samples submitted to the Genomics Core; however, they should be used with appropriate caution.
How to clean DNA templates for sequencing?
Most techniques use ethanol in the final steps. It is crucial that ALL ethanol be removed from purified samples prior to preparing the sequencing reactions. Thus, your final step should include a drying step to drive off residual ethanol. You can either leave the samples uncapped at room temperature for >15', or incubate samples at ~60-70oC (open caps; ~5 min).a) PCR products: The residual primers from the original PCR need to be eliminated prior to sequencing. In some cases, simply diluting the PCR product will give acceptable results; however, it is usually necessary to use a more rigorous process. One option is to use an enzymatic reaction – e.g., ExoSAP – to degrade the ssDNA products, followed by heat-denaturation of the enzyme.
Alternatively, assuming a robust PCR, a standard ethanol precipitation (inexpensive method) will often do an excellent job of eliminating residual primers and primer-dimers; however, do
For further information, see EDTA vs. sodium acetate for DNA precipitation? and 'Dump-&-Blot', pipette, or 'spin-out' ethanol? Also, considering reading the comments at How to clean my sequenced templates?
b) Plasmids: Commercial columns give the best template for sequencing. However, there are numerous 'home-brew' protocols that also are effective.
c) DNA Clean & Concentrator-5 Kit (distributed by Genesee Scientific [Zymo Research product]): For those who prefer column technologies, this is an excellent product that both does a good job of cleaning DNA samples and allows for elution in very small volumes (>6µl). As usual, we recommend eluting in the TVLE (see Choice of primer resuspension buffer?) to avoid any problems with pH issues or minor DNAse contamination, while not interfering with downstream applications. Zymo states that recovery is 70-95% for DNA ranging from 50 bp to 10 kb; as such, the column ought to remove the majority of primers (typically ~18-25 bp oligos) — however, in some cases, you might need to use the Select-a-Size Columns (D4080) instead to achieve sufficient primer removal... especially if primer-dimers are an issue. You can either purchase columns for your lab or have samples processed by the Genomics Core.
d) Notes regarding Commercial columns: First, if using a column to remove primers and primer-dimers, please read the product specifications very carefully... some kits retain sufficient amounts of primer to create problems for sequencing. Second, many protocols finish with a 5-min spin after adding the wash ethanol; however, the ethanol vapor pressure under the column prevents some ethanol from spinning out of the filter. Thus, spin out the wash ethanol (1 min), dump the ethanol and blot collection tubes on a Kimwipe, and finish with a final spin (5 min).
How much DNA to use in a sequencing reaction?
The most common sequencing error is to use too much DNA (either volume or quantity).(1) Volume: higher volumes increase the potential for including ‘reaction-killing’ contaminants in the mix.
(2) Quantity: excessive initial template has two synergistic effects, which can result in dramatically reduced sequence read length: (a) BigDye reagents are exhausted by making very small fragments; and, (b) excessive quantities of small fragments clog the capillary on the sequencer, preventing the injection of longer fragments.
Most commonly, researchers will use a standard spectrophotometer to determine the concentration of DNA samples. If they are really conscientious, they will use a specialized spectrophotometer such as the Nanodrop. However, it is critical to recognize that these instruments have significant limitations for such work (see Why are Spectrophotometers "Bad", and what to do instead?), and that there are better alternatives (see below).
In any case, unless your protocols consistently generate appropriate concentrations of DNA for sequencing, you will save time and money by taking steps to properly quantitate your DNA templates prior to sequencing them. Ultimately, you will use the DNA concentration estimates to determine how many µl of template to add to the sequencing reaction in order to use the optimum mass of DNA.
a) Mass: Mass is being used as a surrogate for "numbers of template molecules"; thus, the ranges below must be scaled to the sizes of the fragments being sequenced. However, the exact values are not exceptionally critical; the template input simply needs to remain within the broad ranges such that neither too little, nor too much, template is added to each BigDye sequencing reaction.
- PCR products (~500 bp): ~2-6 ng.
- Plasmid DNA (~5,000 bp, vector + insert length): 50-200 ng.
- It is advisable to run at least some of the plasmid samples on an agarose gel, as discussed in Why are Spectrophotometers "Bad", and what to do instead?.
- Otherwise, it is usually sufficient to take A260/A280 readings on a random sample of purified templates, and dilute the DNA accordingly. Nevertheless, if readings are not relatively consistent, process all templates; then, for future samples, see How to achieve better cloning results? to minimize the occurrence of variant yields.
- Finally, unless your samples are highly concentrated, you will obtain more reliable results from a low-volume spectrophotometer. Nanodrops can be especially useful in this regard and will also provide some clues as to the presence of contaminating salts (in the absorbance graph, as discussed in Nanodrop tips.pdf); see also Nanodrop Nucleic Acid Guide.pdf.
- Spectrophotometer readings are useless unless PCR products have been cleaned.
- Residue from commercial PCR clean-up kits may give false A260 readings (e.g., water cleaned by a Promega Wizard column can register as ~30 ng/μl).
- There are a variety of other compounds that also absorb UV-light in the range of ~260-280 nM; if these are present in your sample, they will result in falsely elevated DNA concentration readings. A common contaminate is EDTA; another common problem is residual 'organics' from Phenol/Chloroform extractions. For instruments like the NanoDrop, such contamination can be detected by careful examination of the 'trace' (Nanodrop Nucleic Acid Guide.pdf) ... rather than relying solely on the DNA concentration reading.
- Unless the reaction was extremely robust or you are using a NanoDrop spectrophotometer, A260 values are likely to be within the instrument's margin of error.
- Reported DNA concentration is highly correlated with the sample's level of DNA degradation. As such, for the same mass of DNA, a highly degraded sample will register as having much more DNA than will an 'intact' DNA sample.
- One alternative to spectrophotometers is to quantitate your cleaned PCR product with an instrument that relies on a dye that intercalates in the dsDNA. For instance, you could use the Agilent Bioanalyzer (concentration, size distribution & sample integrity) or the Qubit (concentration only). Both platforms have several different kits for different applications; further, they both have their pros & cons. Unfortunately, both options are expensive if you need to accurately quantitate numerous samples.
- Thus, Estimate template input by agarose gels is a strongly preferred method.
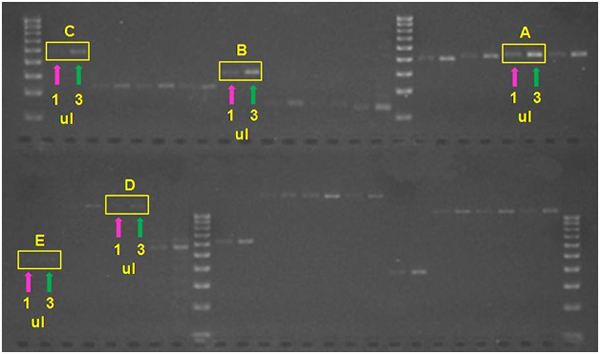
Estimate template input by agarose gels.
Criteria: If the 1-µl band is barely visible and 3-µl band is faint (but distinct), use 1-3 μl of DNA in the sequencing reaction. By contrast, use >3 µl template if only the 3 µl band is visible or use a dilution of your template if the 1 µl band is bright.
In this Weak-Strong PCR products.jpg example, all of the templates might be suitable for use with 1-3 µl in a sequencing reaction. However, ‘A’ is verging on becoming too bright; ‘B’ is perfect; ‘C’ is getting somewhat weak; ‘D’ is extremely weak (especially for a 1-kb product, which should be ~2X as bright as a 500-bp product for the equivalent number of copies) and at least 6 ul should be used; and, even the ~450-bp product for 'E’ would likely do much better if ~6 μl of template were used. In the photo, bands sizes are referenced to the Biorad EZ Load 100 bp Molecular Ruler (#1708352).
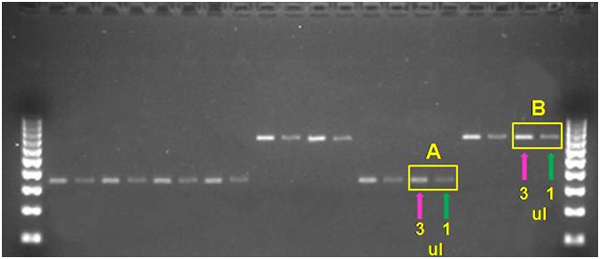
By contrast, in this Strong PCR products.jpg example, sequencing reactions using 1-3 µl of DNA would be appropriate for all of the samples. Still, while samples such as ‘A’ are perfect for using 1-3µl, samples like ‘B’ are verging on being too bright and you might want to consider using ~1 µl rather than 3 µl for such samples. In the photo, bands sizes are referenced to the Biorad EZ Load 100 bp Molecular Ruler (#1708352).
Why are Spectrophotometers "Bad", and what to do instead?
Okay... so "Bad" is a dramatic overstatement. However, with respect to DNA, standard spectrophotometers have some significant limitations:To assess quality, the DNA must be analyzed directly in a 'gel-based' system. Most commonly, this is done with inexpensive agarose gels; however there are other options (e.g., Agilent Bioanalyzer).
- PCR products & Plasmids: It is crucial that the sample not be overloaded on the gel; otherwise, the presence of multiple products (of nearly the same size) can be masked by the excessively broad and bright bands.
- PCR products: can be run directly in gels of the appropriate concentration (based on fragment size).
- Plasmids: ideally, these should be linearized first to eliminate the
coiled and supercoiled forms.
- Restriction enzyme(s) can be used to cut the vector either once (generating a single, long fragment) or twice (to release the insert from the vector); both methods can have their advantages.
- Linearizing a plasmid can also sometimes be helpful for getting better sequencing results; of course, the restriction site cannot be within the desired read or between the desired read and the primer site!
How to interpret 260/230 & 260/280 OD ratios?
Both ratios are useful for determining purity of your DNA & RNA samples. On the Genomics Documents page, see Nanodrop tips.pdf and Nanodrop Nucleic Acid Guide.pdf.Should I use a Nanodrop to quantitate DNA?
A Nanodrop (or equivalent instrument) is still a spectrophotometer, although the small volume (2-µl) required does at least allow users to avoid diluting their DNA samples. However, as described in Why are Spectrophotometers "Bad", and what to do instead?, even a Nanodrop has some significant limitations. Nevertheless, if the sample is relatively free of extraneous nucleic acids and free of compounds that also absorb light wavelengths between ~220-300 nM, the Nanodrop can provide useful information for essentially no-cost. However, one should be aware of the various factors that can badly skew readings from a Nanodrop; for additional details, please see Nanodrop tips.pdf and Nanodrop Nucleic Acid Guide.pdf.Nanodrop Guide for Nucleic Acids?
The Nanodrop Nucleic Acid Guide.pdf provides nucleic acid measurement support information relevant to Thermo Scientific NanoDrop 2000/2000c, 8000 and 1000 spectrophotometers. Please see NanoDrop Quick Tips (pdf) for a quick review of some common issues associated with quantifying nucleic acids with the NanoDrop. Finally, refer to the model-specific user manual for more detailed instrument and software feature-related information.The patented NanoDrop™ sample retention system employs surface tension to hold 0.5 μL to 2 μL samples in place between two optical fibers. Using this technology, NanoDrop spectrophotometers have the capability to measure samples between 50 and 200 times more concentrated than samples measured using a standard 1 cm cuvette.
Nanodrop Guide for Protein?
The Nanodrop Protein Guide.pdf is meant to provide some basic protein measurement support information for direct A280 methods relevant to Thermo Scientific NanoDrop 2000/2000c, 8000 and 1000 spectrophotometers. Please refer to the model-specific user manual for more detailed instrument and software feature related information.The patented NanoDrop™ sample retention system employs surface tension to hold 0.5 μL to 2 μL samples in place between two optical fibers. Using this technology, NanoDrop spectrophotometers have the capability to measure samples between 50 and 200 times more concentrated than samples measured using a standard 1 cm cuvette. The Protein A280 method is applicable to purified proteins that contain Trp, Tyr residues or Cys-Cys disulphide bonds and exhibit absorbance at 280 nm. This method does not require generation of a standard curve and is ready for protein sample quantitation at software startup. Colorimetric assays such as BCA, Pierce 660 nm, Bradford, and Lowry require standard curves and are more commonly used for uncharacterized protein solutions and cell lysates.
Epic Nanodrop Fail (ouch!)
A common refrain after failed sequencing reactions is "But the Nanodrop showed plenty of template!" For a review of one amazing example and the accompanying analysis, please see Epic Nanodrop Fail (pdf).Primer
Choice of primer resuspension buffer?
Ideally, resuspend your stock primers in TLE (i.e., Tris-Low_EDTA: 10 mM Tris, 0.1 mM EDTA) or TVLE (i.e., Tris-Very_Low_EDTA: 10 mM Tris, 0.05 mM EDTA), and use the same buffer to dilute them to working strength. If you resuspend primers in pure water (as is often recommended), the pH of your primer solutions can change easily; if the pH changes dramatically, your primers may be converted into individual nucleotides. Further, any stray DNAse contaminating your primer stock is free to destroy your primers. By contrast, TLE and TVLE will prevent both problems while not interfering with downstream applications – if you are still concerned about the EDTA, keep your original stock at ≥100 µM and then dilute the primers to working strength with nanopure water.Concentration for storage & working stocks of primers?
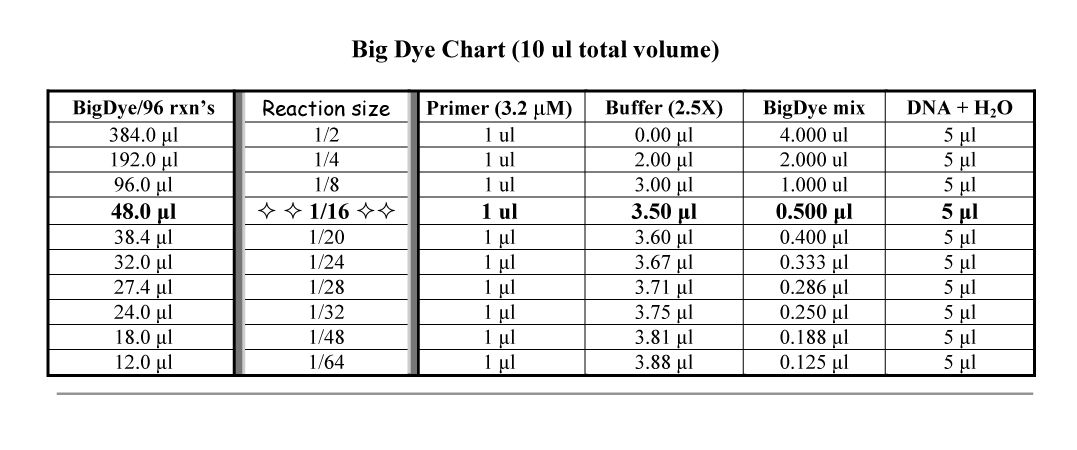
For storage, your primers should be at concentrations of ≥100 µM, as they are more stable. Working stock concentrations vary with your application. For sequencing DNA, ABI recommends a final concentration of ~320 nM; thus, for a 10 µl reaction, your primer stock should be 3.2 µM if you plan to use only 1 µl of primer. However, our in-house testing has shown no appreciable difference in sequencing outcomes when using 1 µl of primer at 2-5 µM.How much primer to use for sequencing reactions?
For sequencing DNA, ABI recommends a final concentration of ~320 nM; thus, for a 10 µl reaction, your primer stock should be 3.2 µM if you plan to use only 1 µl of primer (see chart at How much BigDye should I use?). However, our in-house testing has shown no appreciable difference in sequencing outcomes when using 1 µl of primer at 2-5 µM. Further, if you are doing only a single (or even a few) reactions per primer, you can improve your pipetting accuracy by using 2 µl of a 0.5X working stock (e.g., 2 µl of 2 µM vs. 1 µl of 4 µM stock). If you do use a diluted primer, remember that the volume of 'water' in the Master-mix must be decreased correspondingly.How many primers per sequencing reaction?
One. Unlike PCR, you can use ONLY one primer per reaction when sequencing. More than one primer will lead to multiple signals in the output from the DNA sequencer.Can I use my PCR primers for sequencing?
Generally speaking, 'yes'. However, not all PCR primers make good sequencing primers. Further, if your PCR primers have annealing temperatures that are markedly different from 50°C, you may have to adjust your sequencing annealing temperature if initial results are poor. Finally, as some primers are difficult to fully remove from PCR products (unless using expensive commercial products), it is wise to increase the concentration of your working stocks for sequencing to 10-20 µM (for 1 µl primer/rxn) to help outcompete residual levels of the original PCR primers. Alternatively, given that most PCR recipes use primers in great excess, you could optimize your PCR to use the minimum amount of primers truly required... which in turn will make it much easier to reduce the level of residual PCR primers to inconsequential levels in your sequencing reaction... and, then, you might be able to use the more typical concentrations (e.g., 2-5 µM) for your sequencing primers.'Plasmid' or 'PCR' primer for sequencing?
If you need the sequence immediately after the primer, you must either do bi-directional sequencing or clone your PCR product and use the plasmid primer for sequencing. Alternatively, if you need to reach further into a cloned sequence, you may wish to use your PCR primer as the plasmid primer is usually located 100-200 bp away from your desired product. By using the PCR primer, you shift the maximum 'readable' sequence by that many bp into your product. Also, if there is a difficult to sequence section in your product, moving the beginning of the sequencing effort to the edge of the vector may assist the polymerase in getting through the difficult sequence. See "How to sequence difficult DNA templates? for further information.Annealing temperature for sequencing?
The standard annealing temperature for sequencing is 50°C; however, you may have to raise the annealing temperature if initial results are poor – especially if you are using PCR primers with annealing temperatures that are much greater than 50°C.Why does my primer give multiple signals?
Most commonly, this results either from accidently using two primers or from having two templates present in the reaction. Multiple primers are especially common for PCR products in which the original PCR primers were not fully removed. Multiple templates are common for 'vector-preps' where the researcher failed to observe the colonies under a low-power microscope and accidentally picked merged colonies instead of pure single colonies... as well as for PCR products which did not generate a clean band in your agarose gel or targeted pseudogenes as well as the intended DNA region. Finally, if your primer has degraded on the 5'-end or was manufactured with "n-x" nucleotide(s) – which would omit nucleotides on the 5'-end of the primer due to the way primers are synthesized – it will generate different 'species' of templates which will be 'frame-shifted' relative to each other on the DNA sequencer. However, if you get multiple signals and you are certain that there is only one template and one full-length primer in the reaction, you might have two 'virtual' primers. That is, your single primer is annealing to two different places on the template. See "How to avoid multiple signals? for further information.Primer availability and requirements at the Genomics Core?
- M13-F (5´-GTAAAACGACGGCCAG-3´)
M13-R (5´-CAGGAAACAGCTATGAC-3´)
T3 (5´-ATTAACCCTCACTAAAGGGA-3´)
T7-Promoter (5´-TAATACGACTCACTATAGGG-3´)
T7-Terminator (5´-GCTAGTTATTGCTCAGCGG-3´).
- Stock tube: 1 primer/tube, for inclusion in the Master-mix(es). Minimum volume is the larger of (a) 40 ul, or (b) [# samples * 1.25-ul/sample]. Primers should be resuspended in a low TE product (e.g., TVLE... a GCF supply item). Typically, the primer concentration should be 2-5 μM; however, when sequencing PCR products which might contain residual PCR primers, clients are encouraged to provide higher concentrations of primers (i.e., 10-20 µM for 1 µl/rxn; or, 5-10 µM for 2 µl/rxn).
- Pre-pipetted: primer included with each template (1 µl primer @ 2-5 µM, or 2 µl primer @ 0.5X concentration); if sequencing PCR products, it is best to use 10-20 µM primers (if using 1 µl/rxn) or 5-10 µM primers (if using 2 µl/rxn).
Buffer
Why is a buffer necessary for sequencing?
The BigDye Terminator 3.1 solution contains all the necessary ingredients (MgCl2, 2.5X buffer, dye-labled nucleotides, and polymerase) for a sequencing reaction – except for the primer and template; thus, no buffer is needed for a standard 1X reaction (defined by ABI as 8 µl of BigDye in a 20 µl reaction). From an empirical perspective, there remains no major need for the buffer when using at least 2 µl of BigDye per reaction. However, when using less BigDye, it becomes critical to replace the lost buffer and MgCl2. Further, the 'home-made' buffer is so inexpensive that it simply makes sense to use it (vs. water) in anything less than a 1X reaction.How much do I save by replacing BigDye with Buffer?
On the ThermoFisher website, the list price for a single tube of BigDye (nominally 800 µl; Cat. #4337455) was ~$1,252 (as of 06Jan20). Using 0.5 µl of BigDye per 10 µl reaction will typically give excellent results, while reducing the cost of the BigDye for each reaction to ~78¢ (~$75 per 96-well plate) – which compares very favorably to ~$12.52 for a 1X reaction (~$1,202 per 96-well plate). Even if you insist on using the ABI 5X sequencing buffer (28 ml, $1,384 – 06Jan20) vs. virtually-free home-made buffer, your costs will still drop to ~95¢ per reaction (~$91 per 96-well plate). Greater cost savings can be achieved by reducing the amount of BigDye to less than 0.5 µl per reaction; however, there are additional issues to consider. See How much BigDye should I use? for further information.Do 'home-made' & ABI versions differ in performance?
We have extensively tested the two buffer solutions. If anything, our 'home-made' version may perform slightly better than ABI's version; however, any perceived differences in performance have been extremely minor. By contrast, the ingredients to make ~1,200 ml of our 'home-made' 5X buffer cost cost ~1/10 the price of a 28 ml bottle of ABI's 5X buffer.What is the buffer's composition?
Our 'home-made' buffer is made from liquid, nuclease-free, commercially-prepared ingredients (water, MgCl2, and Tris, pH 9.0). At a 5X concentration, the composition is 400 mM Tris and 10 mM MgCl2, which is identical to the recipe once published by ABI (although the information has since been scrubbed from official documentation).How much buffer do I use?
In short, the total volume of [What should my final buffer concentration be?
The buffer concentration in the BigDye Terminator mix isBigDye Terminator mix v3.1
What is the maximum "Ramp Rate" for BigDye?
BigDye can be very sensitive to high ramp rates in thermalcycling, particularly if the reaction is greatly diluted (e.g., ≤0.5 µl BigDye in a 10-µl reaction, which is equivalent to a 1/8X reaction compared to the manufacturer's recommendation of 8 µl BigDye in a 20 µl reaction). ABI recommends holding ramp rates of 1oC/second, although our sequencing results (even with 0.1 µl BigDye per 10 µl reaction) work well in the ThermoFisher Veriti cyclers at a default ramp rate of 3.4oC/second. See also What is the standard PCR sequencing protocol? and Why am I suddenly getting poor quality Sequencing Reactions?.Why is BigDye Terminator mix v3.1 required?
Samples must be sequenced with ABI BigDye Terminator v3.1; otherwise, your samples may generate inaccurate base calls due to incompatiblity with our Spectral calibrations. See Documents & Protocols for further instructions.How many times can BigDye be frozen/thawed?
BigDye chemistry degrades after 5-10 freeze-thaw cycles. See also Why aliquot original tube of BigDye Terminator mix v3.1? for further information.Why aliquot original tube of BigDye Terminator mix v3.1?
a) BigDye chemistry: degrades after 5-10 freeze-thaw cycles – an issue that looms ever larger as the amount of BigDye is decreased in sequencing reactions. If you typically perform 96 reactions each time, your aliquots should be <500 µl (b) BigDye scales: Typical DNA templates can be sequenced with as little as 0.5 μl (or less!) of BigDye in a 10 μl reaction; thus, a stock tube of BigDye can nominally generate up to 1600 reactions – enough to process over sixteen 96-well plates. However, see What is the maximum "Ramp Rate" for BigDye?, as diluting the BigDye increases its sensitivity to rapid ramp rates of thermalcyclers.
c) Aliquoting: To prepare the BigDye for aliquoting, vigorously vortex the thawed BigDye (~ 30 s) and spin it down. Lazy vortexing can lead to future sequencing failures due to inadequate homogenization of the BigDye prior to aliquoting. Store aliquoted BigDye at -20oC.
How much BigDye should I use?
a) Diluting BigDye: When using less than the manufacturer's recommended amount of BigDye (i.e., <4 µl of BigDye per 10 µl reaction), you must replace the missing volume with the proper Sequencing Buffer (either the manufacturer's version or 'home-made' [see What is the buffer's composition?]). NOTE: Do NOT confuse this buffer with the one used on the 3130xl itself... the EDTA in that buffer will shut-down sequencing reactions!
b) BigDye volumes explained!
Note: For reactions using ≤0.5 ul BigDye, the total volume of the reaction should be ≤10 ul.
Why vortex BigDye vigorously?
Protocols from ABI recommend using 8 μl of BigDye in a 20 μl reaction. When using this much BigDye, the mix components are in such excess that thorough mixing is irrelevant. However, mixing becomes a critical issue when using small volumes of BigDye (≤0.5 μl per 10 μl reaction). At such volumes, sequence read length and quality can become erratic unless the thawed Bigdye mix is vortexed vigorously (i.e., vortexer on high, ~30 seconds).Sequencing Reaction
How to prepare sequencing reactions?
a) DNA template: Add to bottom of wells, taking care not to cross-contaminate wells.i) Sample placement: Try to group templates of similar desired read lengths into 'sets of 16' (e.g., wells A1-H1 and A2-H2). Because the sequencer processes 16 samples at a time, we can adjust module run times for each 'set of 16', thereby returning your results faster when you request shorter (i.e., <800 bp) read lengths. Also, see Why does the location of my samples in a 96-well plate matter?)
ii) Positive Control placement: A particular capillary in the array will always process the same relative well location from each set of 16 (e.g., the same capillary processes wells A1, A3, A5, A7, A9, & A11). Thus, you should place your positive controls such that they will be processed by different capillaries.
iii) Caution: Spin plate prior to adding any other reagents.
b) BigDye: Thaw, vortex vigorously, and place on ice – otherwise data quality may suffer.
c) Master-mixes: Use them to minimize variation; add to top of wells. Commonly, they are made as follows:
i) Single primer: everything, except DNA templates.
ii) Multiple primers (only 1 per master-mix): Consider making an overall master-mix of the Buffer, BigDye, and Water... and then use it to make submaster-mixes with each primer. If there are too few reactions with each primer, then add primer to the top of each well instead (without cross-contaminating wells with DNA templates already present... and spin plate before adding master-mix. See How much primer to use for sequencing reactions? for further information.
d) Total volume: At BigDye concentrations of <1/16X, reaction volumes >10 μl significantly reduce signal strength and read length; even 1/16X reactions perform better at 10 μl total volume.
e) Final step: Seal plate, spin, and put in the PCR machine. (Note: Normally, it is not necessary to keep the 96-well plate on ice while preparing reactions.)
What is the standard PCR sequencing protocol?
a-1) Official ABI BigDye v3.1 cycling parameters:a-2) LSU Genomics Core cycling parameters: For most templates, this abbreviated cycling protocol generates 900+ bp reads with strong signal intensities.
– Extension Time: Even a 1-min extension is typically sufficient to generate 900-bp reads; 2-min provides a buffer in case templates are somewhat difficult to extend... but, 4-min is just a waste of time.
– Hold Temperatures: A 10oC hold keeps reactions chilled while minimizing the strain on the thermalcycler... which cannot really achieve 4oC and thus never stops cooling if set for a hold at 4oC.
– Difficult templates: Thermal cycler parameters may need to be adjusted for templates that exhibit strong secondary structure (e.g., high GC content; microsatellites; and, homopolymers); see
How to sequence difficult DNA templates?
– Low Tm primers: It might be necessary to decrease the Annealing Temperature below 50oC in cases where primer Tm values are exceptionally low.
b) Ramp rate: ABI has stated that BigDye can be sensitive to high ramp rates in thermalcycling, particularly if the reaction is greatly diluted (e.g., ≤0.5 µl BigDye in a 10-µl reaction, which is equivalent to a 1/8X reaction compared to the manufacturer's recommendation of 8 µl BigDye in a 20 µl reaction). According to ABI, best results are obtained with ramp rates of 1oC/second; HOWEVER, we have seen
c) Post-run: Clean samples immediately or after temporary storage in the refrigerator (overnight) or freezer.
How to sequence difficult DNA templates?
Sometimes, you will encounter DTS (difficult-to-sequence) templates that defy your standard sequencing techniques – even though you have verified that the templates and reagents are in good condition. The reactions may fail altogether, or they may work very well initially and then fail at a particular stretch of sequence. If you examine the last ~50 bp, you will likely see that the region was very GT-rich (or possibly GC-rich) or that the segment consisted of microsatellites – either of which leads to secondary structure, causing the polymerase to fall off.In this case, you can try the following ideas – either singly or in various combinations. (Note: This is not the same situation as when your signal intensity initially soars and then plummets after ~150 bp.)
a) BigDye: Use more BigDye to help force the reaction through the secondary structure.
b) Template denaturation: Pipette the DNA (and possibly the primer too) into the 96-well plate; seal with caps; denature for 5 minutes at 96-98oC; and bury plate in ice until ready for use. After preparing the mastermix (iced), briefly spin plate prior to opening caps, set plate back on the ice asap, and add the mastermix. Keep plate on ice until the PCR machine is ready.
c) Hot-start: Include a hot-start (5 min, 96-98oC) at beginning of cycling; further, don’t put the plate into the PCR machine until it is hot.
d) Denaturation temperature: Increase during cycling from the standard 95oC to 96-98oC.
e) Cycles: Increase from standard 25 cycles (up to a maximum of 50).
f) Primer design: Design new primer closer to difficult site.
g) Additives (e.g., DMSO): Sometimes, when secondary structure is extreme, various additives (e.g., DMSO or betaine) can be included in the BigDye Master-Mix to improve sequencing results. However, please note that additives can also have adverse effects on DNA sequencing efforts; thus, they are not routinely added to all reactions.
When requesting that the Genomics Core use additives with your DNA sequencing requests, you must specify the desired volume of additive and the cycling parameters in the Client Memo box for your online submission. The Genomics Core generally has DMSO available; however, if needed, betaine or another additive of your choice could be ordered. If requesting additives other than DMSO, please consult with the Genomics Core prior to submitting samples to ensure that your request can be accommodated.
h) Other dye Chemistries: ABI states that BigDye is recommended for AT-Rich and GC-Rich regions and is satisfactory for GT-rich regions; however, ABI recommends the following dye chemistries for GT-rich regions: dGTP, dRhodamine, or BigDye Primer. For homopolymer A or T regions, ABI states that BigDye Terminator is not recommended, but that dRhodamine is satisfactory. If you plan to use these non-Bigdye Terminator 3.1 chemistries,
 This example of a
Difficult_Template.jpg containing a stretch of high ‘G’ content shows results of standard sequencing (top) and modified
sequencing (bottom). Even with the modified sequencing, the signal strength
still dropped precipitously after the zone of secondary structure; nevertheless,
adequate signal strength was maintained for the remainder of the sequence.
When the same template was sequenced with a primer located closer to the high
‘G’ zone under the same modified protocol, there was only a moderate
drop in signal strength (figure not shown).
This example of a
Difficult_Template.jpg containing a stretch of high ‘G’ content shows results of standard sequencing (top) and modified
sequencing (bottom). Even with the modified sequencing, the signal strength
still dropped precipitously after the zone of secondary structure; nevertheless,
adequate signal strength was maintained for the remainder of the sequence.
When the same template was sequenced with a primer located closer to the high
‘G’ zone under the same modified protocol, there was only a moderate
drop in signal strength (figure not shown).
Why include positive controls?
Including positive controls enables you to troubleshoot any sequencing problems more effectively. However, without positive controls run in the same sequencing reaction using the same mastermix, you have no idea where to begin troubleshooting.a) Good Results: If your reagents are viable and your technique is good, commercially-prepared pGEM®3Zf(+) DNA (with M13 primer) will provide good quality reads of >800-900 bp on a 50-cm capillary with POP7.
b) Poor Results: there are five primary culprits to consider:
(b-1) 3130xl malfunction;
(b-2) Template;
(b-3) Sequencing reagents;
(b-4) Technique (including dirty pipettes); and,
(b-5) PCR machine (or plastic wares used).
i) Controls work well: Focus on item ‘b-2’ (template); but don’t totally exclude other possibilities. In particular, import sequences into Sequence Scanner (see 'Software' link) and view the 'plate report' ; if one capillary always shows a poor result, that points to a bad array on the 3130xl.
ii) Controls work poorly or fail: Template issues are less likely. Item ‘b-1’ can usually be eliminated by comparing your results to those of other users or those of standards that were run at the same time. In that case, focus on items ‘b-3, b-4 and b-5’. Please contact the staff in the Genomics Core for further guidance on this topic.
For further information on the issue of 'positive controls', see How to set up my positive controls? and Why does the location of my samples in a 96-well plate matter?. It is difficult to overemphasize how much trouble can be saved through including positive controls, especially given the miniscule costs of preparing and running those controls compared to redoing many of your samples!
How to set up my positive controls?
a) DNA template: pGEM®3Zf(+) consistently works well. However, if necessary, other DNA sources can be used as positive controls, and may be preferable if your primers will not work on pGEM. Ultimately, the positive control template must be one that you personally have shown works well when you have properly set up a sequencing reaction.b) Primer choice: M13 (F or R) primer is an excellent choice for use with pGEM®3Zf(+) – sequencing results with T3 or T7 are somewhat less robust. However, please note that, unless the same primer is used for both samples and controls, better results with the controls could be caused two different factors:
(i) low quality template; or,
(ii) degradation of the primer used to sequence your actual samples.
c) Technique: Ensure that controls are sequenced using the same mastermix as your samples. If different primers are used, you should initially make a primer-free BigDye Mastermix and split it into sub-mastermixes (i.e., one for each primer). For pGEM®3Zf(+), use 50-200 ng of DNA.
Ideally, at least two controls should be prepared for any submission; for large submissions, consider using at least one control for each set of 16-32 wells. When submitting >16 samples, please place your controls such that:
(i) they will all pass through different capillaries; and,
(ii) the controls are split evenly amongst 'sets of 16'.
Why does the location of my samples in a 96-well plate matter?
The 3130xl sequencer processes plates in sets of 16 (see 'Sample placement' in How to prepare sequencing reactions?); further, a particular capillary in the array will always process the same relative well location from each set of 16 (e.g., the same capillary processes wells A1, A3, A5, A7, A9, and A11).a) Duplicate samples: If each member is processed by different capillaries, variation in the results is influenced by the relative quality of the capillaries used; by contrast, if processed by the same capillary, variation should be due primarily to differential efficiencies between the sequencing reaction of each well in the PCR machine.
b) Controls: When processed by different capillaries, controls tells us more about how well the entire array is working; by contrast, when the same capillary is used, variation in the results tells us more about the PCR machine that was used to perform the sequencing reactions.
c) Run times: For further information, see Can advance planning achieve more rapid results?.
Can advance planning achieve more rapid results?
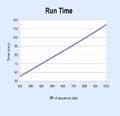 The 3130xl sequencer processes samples in sets of 16; thus, consolidating samples of
similar desired read length into sets of 16 can increase sample throughput by letting
us decrease run times. For example, if the maximum read length required is 200 bp for
samples in A1-H2 and 800 bp for samples in A3-H4, we can set the run module of A1-H2
for ~1/2 the time of the run module for A3-H4. Given that the standard run module takes
~120 minutes, this can result in considerable time savings. See Run_Time_Modules.jpg for a full comparison of Run Time vs. Sequence Length.
The 3130xl sequencer processes samples in sets of 16; thus, consolidating samples of
similar desired read length into sets of 16 can increase sample throughput by letting
us decrease run times. For example, if the maximum read length required is 200 bp for
samples in A1-H2 and 800 bp for samples in A3-H4, we can set the run module of A1-H2
for ~1/2 the time of the run module for A3-H4. Given that the standard run module takes
~120 minutes, this can result in considerable time savings. See Run_Time_Modules.jpg for a full comparison of Run Time vs. Sequence Length.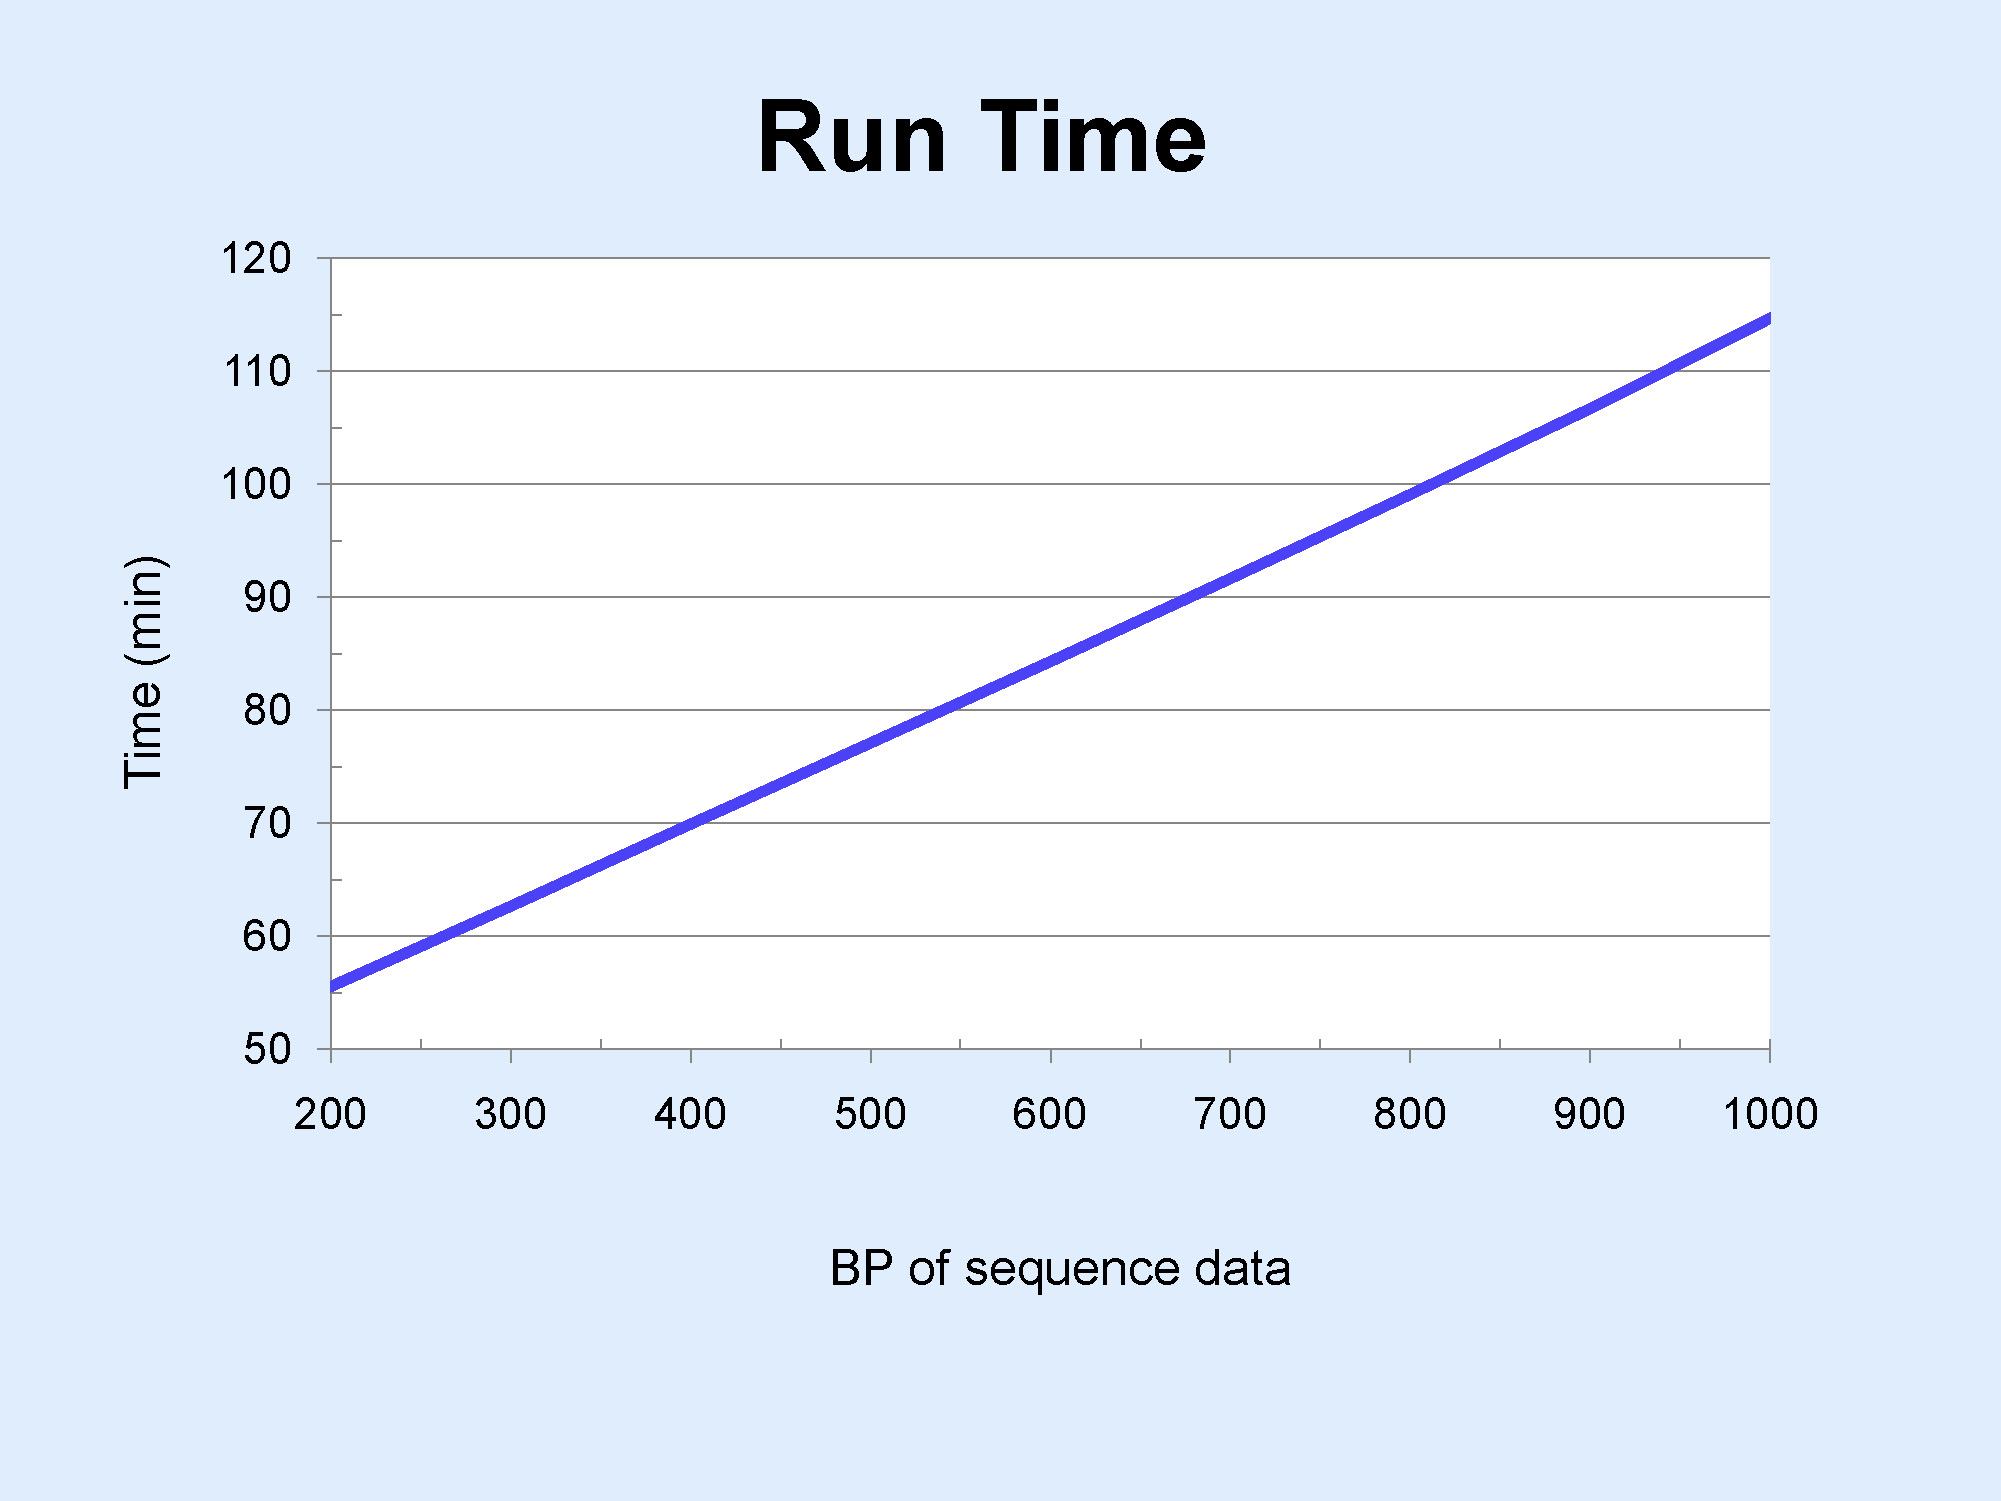
However, the stated desired read length must be sufficient to acommodate all 16 sequences in the set; otherwise, longer sequences will be terminated prematurely. For example, if the desired read length for the sequence in H2 were actually 800 bp (see above paragraph), requesting 200 bp for A1-H2 would be inappropriate.
Can I reuse plates (tubes) for sequencing?

No, No, No ! ! !
For further information, see
What causes a low-level
signal after the PCR-stop?
(Snowball_Joke.jpg)
Post-sequencing reaction
How to clean my sequenced templates?
Cleaning your sequenced reactions accomplishes two purposes.– It removes PCR components which might interfere with the migration of the sequenced DNA through the capillaries.
– It removes the unincorporated
a) Ethanol precipitation: inexpensive, simple, and generates good quality data, if you use one of the two following protocols: Sequencing EtOH-Precipitation (Plate protocol).docx]; or, Sequencing EtOH-Precipitation (Tube protocol).docx. The plate protocol is definitely superior to the tube protocol, but not everyone has access to a plate centrifuge. Click Foil cap.jpg and 96-place racks.jpg to view two of the tools used in these protocols. For further information, click EDTA vs. sodium acetate for DNA precipitation? & 'Dump-&-Blot', pipette, or 'spin-out' ethanol?.
b) ZR DNA Sequencing Clean-up Kit (available directly from Zymo Research or its distributor,Genesee Scientific): For those who prefer column technologies to Ethanol-cleanups, this Zymo product can be an acceptable alternative and the manufacturer claims that the columns can be regenerated up to 10X with 0.1% HCl. However, in our hands, parallel cleanups of split reactions resulted in much lower signal intensities from the Zymo column (vs. our Ethanol-EDTA protocol), which could cause problems with basecalling of weaker sequencing reactions. Further, although the protocol claims that samples can be eluted in 20% formamide and run directly on the sequencer, we
c) Commercial 'gel-filtration' columns: more expensive. Some people attempt (as we did at one time) to reduce costs by reusing these columns after "rinsing" them and storing them with new 'buffer'. However, although this process can be done without carry-over of sequence from one use to the next, reuse of the columns does lead to unincorporated dye terminator peaks ~70 bp into the DNA sequence. In addition, after the first use, small amounts of the 'gel' can bypass the membrane on a plate and end up in the sample well; this gel will bind the dye-labeled products, leading to poor signal intensities unless the 'purified' samples are allowed to resuspend for several hours at 4oC. As such, we have stopped using the commercial plates altogether, preferring to use the inexpensive and highly effective EtOH-EDTA option instead.
d) CleanSEQ by Agencourt: costs ~$0.70/sample, but yields extremely clean DNA and exceptional sequence reads. Please see us prior to using this method. There are now other similar products that are reported to be just as effective, but much less expensive.
e) BigDye® XTerminator™ Purification Kit (ThermoFisher Part #s 4376484-4376486): As of June 2021, List price ranges from $2.35/rxn (1000 rxn kit) to 1.53/rxn (2500 rxn kit). Vendor claims complete removal of dye blobs and better sequencing results overall; method requires the addition of only two reagents (sequentially or premixed), followed by vortexing for 30 minutes.
In our tests, XTerminator worked well and was extremely simple to use (samples are never dried nor resuspended). However, our EtOH-precipitation cleanup gave the same quality of sequence and an additional 70-100 bp of sequence (>900 bp vs. ~830 bp for BDx). Nevertheless, given that there are absolutely no losses of sequenced product or of signal strength, this method may be an excellent choice if your reactions typically have low signal strength.
EDTA vs. sodium acetate for DNA precipitation?
Although we recommend using EDTA, you may use sodium acetate to precipitate your sequenced DNA. However, in our experience, labs that use sodium acetate have greater problems removing the unincorporated dye terminators than do labs that use EDTA.As a result, samples from lab using sodium acetate tend to have a massive peak in the first 50-80 bp of each electropherogram, obliterating ~10-20 bp of data. Further, because the basecalling software scales all peaks to the highest observed peak, this dye terminator peak also causes the real peaks to be 'squashed' – making it hard for the software to decipher the trace data.
ABI's product insert (pdf) for BigDye Terminator Mix v3.1 (cms_041329.pdf) lists two ethanol precipitation methods: EtOH–EDTA; and, EtOH–EDTA–sodium acetate. Both methods have benefits and detriments, and neither uses sodium acetate without EDTA.
'Dump-&-Blot', pipette, or 'spin-out' ethanol?
Even moderate levels of unincorporated dye terminators (UDT's) can adversely affect your sequence data. First, the UDT's appear as a massive peak about 50-70 bp into your sequence – obliterating ~10-20 bp of data. With exceptionally high UDT levels, secondary peaks appear about 40 bp later – sometimes even tertiary peaks will form. Second, the software scales all peaks to the highest observed peak; thus, your real peaks will be 'squashed', making it hard for the software to decipher the trace data – especially towards the end of your sequence. The methods below are ranked in order of their ability to fully remove the UDT's.How to resuspend cleaned, sequenced templates?
a) Dry: Ensure that samples are completely dry (i.e., all water and ethanol have been removed). If using a thermalcycler for drying samples and ending the dry cycle with a 'hold', ensure that the 'hold' temperature is ≥25oC (i.e., it needs to be several degrees ABOVE room temperature); holds at low temperatures can lead to the room's humidity condensing in the samples, which may degrade the BigDye... particularly the G-nts.b) Resuspend: To wells with samples, add 15 μl of Hi-Di formamide. For further information, see What kind of formamide should I use? and Why keep formamide 'dry'?.
i) Do NOT create ‘Sets of 16’ by putting formamide in blank wells; we may need them!
ii) Seal samples; lightly vortex (optional, do so only if seal integrity is definitely ensured); and, briefly centrifuge (store at 4oC or freeze).
c) Options: See When to resuspend in water vs. formamide? for further information.
When to resuspend in water vs. formamide?
With good technique, signal strengths should be well above the minimum threshold when samples are resuspended in formamide. However, if signal strength is a problem even after thoroughly troubleshooting your situation, consider resuspending your samples in water as this can increase signal strength by ≥10X. Nevertheless, please note the 'Caution 1: Samples should be overlain with mineral oil to prevent oxidation and sample evaporaton. Without the oil overlay, your samples may degrade substantially if they are not run soon after being resuspended; with the overlay, sequenced DNA is nearly as stable in water as in formamide. Further, freezing your resuspended samples until they are run on the 3130xl instrument may help to limit the degradation.
Caution 2: If omitting the oil overlay, resuspend in ≥20-µl of water to minimize the likelihood that evaporation will reduce sample volumes below the minimum required for the capillary array pins to make good contact with the samples. Poor contact will lead to reduced signal; no contact will, of course, lead to failed injections. ABI specifies a minimum of 7-µl, but notes that even a slight tilt to the autosampler can mean that >7-µl will be required in some wells; thus, the true minimum is more like 10-µl. Do NOT assume that covering samples with the septa mat will deal with this problem; water evaporates easily through the septa mat, even when inside the 3130xl sequencer. Evaporation rates vary among sequencers (perhaps due to their location relative to room air ducts); however, in our Core, for a single full 96-well plate, a starting volume of 20-µl has been sufficient. As it takes ~12-hours to run a full 96-well plate (using the standard run module for POP7 and a 50-cm array), samples resuspended in water (without the oil overlay) should be run first if >1 plate is loaded onto the instrument.
Caution 3: If considering this option (i.e., water resuspension), please note that excessively strong signal reduces read length.
Caution 4: One purpose of resuspending samples in formamide is to maintain the DNA in a denatured state. So far, we have not noticed any problem with using water instead of formamide; however, resuspension in water might be inappropriate if your templates are capable of forming substantial secondary structure.
What kind of formamide should I use?
When used to resuspend DNA sequence products, high quality formamide is essential for reproducible data; thus, we strongly recommend using ABI's Hi-Di formamide. Formamide purchased from other commercial suppliers is often contaminated with water and undesirable organic and inorganic ions. In addition, formamide is often supplied in glass bottles, which (when opened) exposes the formamide to the air and allows the formamide to absorb water. Minerals may also leach from the glass into the formamide.To give you a sense of the degree of purity needed, here is a brief description of the process of preparing raw formamide for use in DNA sequencing. First, the raw (prior to deionization) formamide must be ≥99.5% purity, have low water content, be packed under an inert gas, and have a conductivity of ~100 µSiemens/cm. Impurities (such as ammonium and formate ions) are removed by passing the raw formamide through a mixed-bed resin containing specific strong ion-exchange functional groups (cationic and anionic). Finally, alkaline EDTA (200 mM, to minimize the addition of water) is added to the deionized formamide to stabilize it and to facilitate the electrokinetic injection of DNA. For further details, see Why keep formamide 'dry'? and review ABI Publication 4315832C.
Why keep formamide 'dry'?
 Store formamide in the freezer to prevent absorption of water; when expecting to
use formamide repeatedly during the day, you may keep a small amount in the refrigerator.
Water reacts slowly with formamide to produce formic acid (methanoic acid) and
ammonia. As shown in
Formamide_water.jpg, the ionic products of this reaction cause two problems:
Store formamide in the freezer to prevent absorption of water; when expecting to
use formamide repeatedly during the day, you may keep a small amount in the refrigerator.
Water reacts slowly with formamide to produce formic acid (methanoic acid) and
ammonia. As shown in
Formamide_water.jpg, the ionic products of this reaction cause two problems: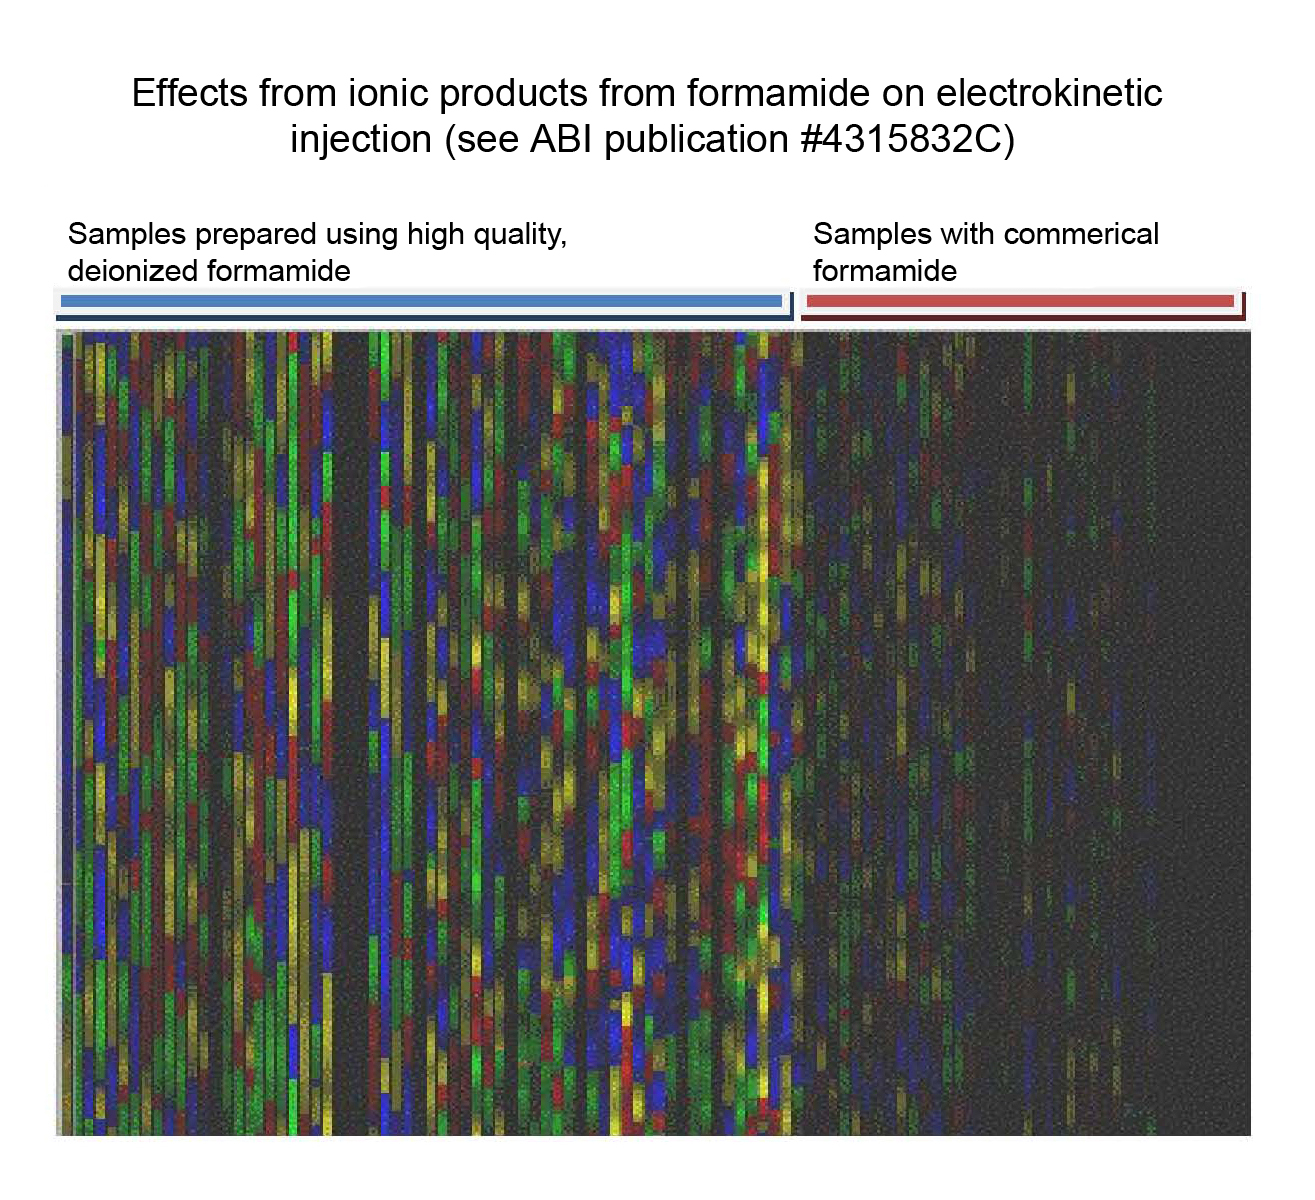
Deionized formamide containing an alkaline stabilizer minimizes these problems.
Excerpt from page 122 of the DNA Sequencing by CE Chemistry Guide.pdf (PN 4305080, Rev. C, 05/2009):
Why restrict freeze-thaw cycles for formamide?
Store formamide in the freezer to prevent absorption of water; when expecting to
use formamide repeatedly during the day, you may keep a small amount in the refrigerator.
Water reacts slowly with formamide to produce formic acid (methanoic acid) and
ammonia.Excerpt from page 82 of the DNA Fragment Analysis by CE Chemistry Guide.pdf (PN 4474504, Revision B):
Note: One of my contacts at LifeTechnologies suggested that a maximum of 5 freeze-thaw cycles would be fine. Further, I have found it acceptable to keep HiDi Formamide in the refrigerator for at least 3-4 weeks... as long as the tube is removed from the refrigerator for the minimum time needed to resuspend samples and the lid is kept closed unless actively pipetting formamide from the tube. Personally, each time I thaw a new 25-ml bottle of HiDi, I aliquot the formamide into five 5-ml tubes, put one in the refrigerator and freeze the other four tubes for later use.
Submitting samples
How to submit samples to Genomics Core?
STEP #1: Login to Genomics Core website to access ‘Request Form’.- Submission type:
- Select the submission portal appropriate for your desired service (i.e., FA or DNA Sequencing Options #1, #2, or #3).
- Submissions must comply with the instructions at Services – ABI 3130xl.
- Sample names:
- Download the applicable Excel (*.xlsx) template; follow Instructions to fill out all required information.
- Save file to your computer under a new name (
critical point , without spaces in the name). - While on the Request Form on website, browse to the saved file, and select it.
- Other information: Fill out appropriately, including comments (if desired).
- Submission Number: This will be assigned once you click "Submit".
- 96-well Plates:
- Type: Complies with the regulations stated at Which 96-well plates are acceptable?
- Labeled with,
- Submission Number;
- PI name; and,
- Submitter name.
- Tubes:
- Type: Complies with the regulations stated at Which format -- tubes or 96-well plates?
- Labeled as follows,
- Number the 1st and last (usually the 8th) tube of each Strip sequentially, from "1" to "X" (i.e., the total number of tubes in your submission) – according to layout on Sample Name file.
- Number the actual tubes (caps will be removed).
- Put numbered Strips in one of Genomics Core's 96-well racks (for 0.2-ml tubes).
- Label the rack as described above for 'plates'.
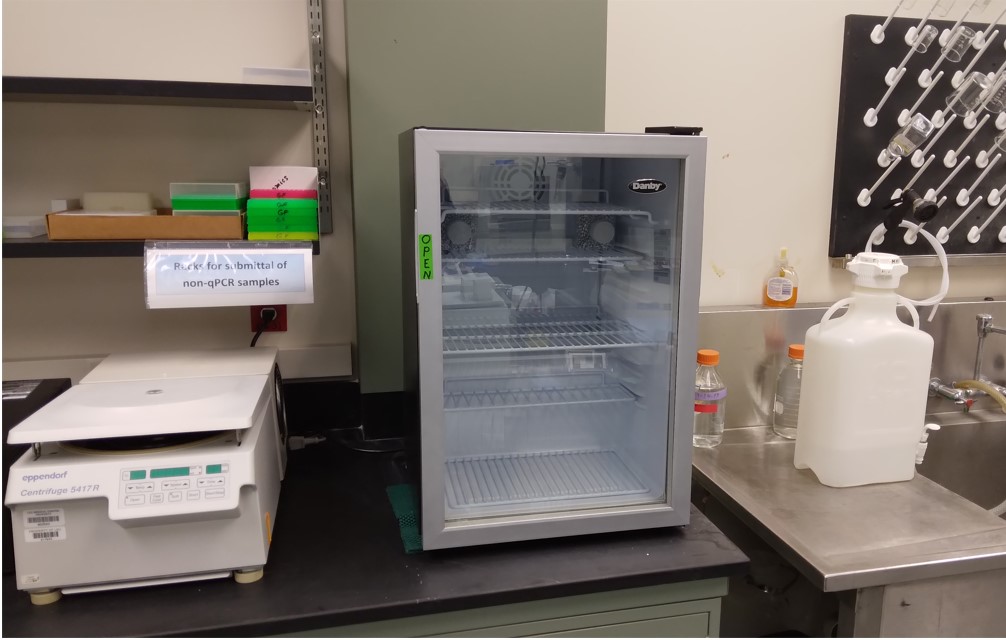
Which format -- tubes or 96-well plates?
Either is acceptable, provided you use plates that are known to fit on the 3130xl's 96-well plate bases or else
- Submissions of
individual or tubes >0.2 ml might be rejected due to the increased risk of loading errors, contamination, and sample loss. - Ensure that caps come off easily; otherwise, opening the tubes may splash samples into other tubes. For styles with extremely tight-fitting caps, seating and removing the caps before use may sufficiently loosen the seal.
- Individually-attached caps:
A) If submitting samples ready for electrophoresis on the 3130xl, cut the cap hinges with a razor blade (or small nail clippers) as the tubes will be loaded directly into the 3130xl's 96-well plate bases.
B) If submitting templates for Full-Service sequencing by the Genomics Core, please use one of the two preferred tube styles noted in How to seal my finished plates or tubes?; however, if you insist on using strip-tubes with individually-attached caps, do NOT cut the hinges (caps will be needed during sequencing and cleanup).
Which 96-well plates are acceptable?
Special plates are not required; however, your 96-well platesSkirt: Plates can have a skirt, as long as it is similar to the skirt on ABI's 96-well plates (Part No. N801-0560). Please note that the
If you have any doubts as to the suitability of your 96-well plates, please bring one to the Genomics Core and we can test it for you.
May I cut my 96-well plates to a smaller size?
Yes — but the plate- Retain at least 2 columns.
- Retain an even number of columns.
- Begin samples in an odd column, in terms of either the numbers preprinted on the plate or when counting from the left side of the partial plate.
- For a plates with a skirt, slice off the appropriate end(s) of the plate (left, right, or both) such that the plate can be positioned correctly on the plate base.
Why 0.2 ml tubes (vs. larger tubes)?
Larger tubes create handling problems for us; by contrast:- 0.2-ml tubes can be placed directly into a plate base for the 3130xl; thus, samples don't have to be transferred to a 96-well plate.
- if samples are transferred to a 96-well plate, an 8-channel pipettor can be used – thereby transferring samples much faster and with less risk of pipetting them into the wrong wells.
Why leave blank wells empty?
In the past, we used empty wells for either our own positive controls (which provide data on how well the 3130xl itself is performing during your runs) or for combining other samples with yours on a run. However, generally speaking, we no longer use empty wells in those ways due to a number of concerns. Nevertheless, it is still good practice to leave any blank wells 'empty' because there's no ambiguity about whether 'blanks' on your Excel template are truly blank or represent a failure on your part to include sample names for those wells. In the event that you are considering using some of your own 'blank' wells, please see What can blank wells have contained previously? prior to transferring any samples to those wells.What can blank wells have contained previously?
Ideally, wells lacking a DNA sample (for sequencing or fragment analysis) would never contain liquids prior to arriving in the Genomics Core. However, it may simplify ethanol-cleanup procedures to pretend that the empty wells have samples in them. As long as the ethanol and EDTA solution are completely removed (preferably by spinning plates upside-down), those chemicals shouldn't be a problem with regard to using the wells for other samples.How to seal my finished plates or tubes?
A) Plates: commercial sealing films, clear 3M™ packing tape, or caps. However, if using caps, theyB) Tubes: The caps
- be easy to remove (prevents splashing of samples); and,
- preferably, either be completely unattached to the tubes or be attached by a single hinge at one end of the strip.
- Note: Strips with caps individually-attached to the tubes will be accepted, but require extra effort and are more likely to create problems in processing samples.
Rapid sequencing results?
Run times on the 3130xl sequencers are controlled by the length of read desired. If you don't need >800 bp of sequence data, we can process your samples faster by selecting a run module with a shorter run time. You provide the desired read length (from the primer) on the Excel spreadsheet, which you use to upload your sample names. For further information, see 'Run times' under Why does the location of my samples in a 96-well plate matter?Please note that all samples in a set of 16 (e.g., A1-H2) are processed with the same run module; thus, you must select a read length that will accommodate all samples within each set of 16. However, there is no need to provide a 'fudge' factor when stating your desired read length; e.g., a '300-bp' run module will collect at least ~400 bp of data.
Data analysis
How long does it take to obtain my sequence data?
a) Standard run module: ~2 hr for a single run (16 samples); ~6 hr for a half-plate (48 samples); and, ~12 hr for a full plate (96 samples).b) Modified run modules: as little as ~6 hr for a full plate (e.g., when selecting "M.L.=400" -- which typically generates ~500 bp of data). For further information, see 'Run times' under Why does the location of my samples in a 96-well plate matter?
c) Turn-around Time: Typically, results are available within 1-3 working days of submission.
How do I obtain my sequence data?
a) Genomic Core website: When your sequences are ready, you will receive an automated email directing you to 'login', click on 'Submission History', and then click on the link to your 'Data' file.b) 'Data' files: “zipped”, reducing ~30 Mb of data from a full plate (96 samples) to ~10 Mb; after 60 days, all files are archived.
How to analyze my data?
a) Format: Results are available as text files and electropherograms.i) Text files, accessible through DNAStar, BioEdit, or Notepad.
ii) Electropherograms, accessible with freeware (Software links):
(1) Sequence Scanner v1.0 – excellent quality-control tool;
(2) BioEdit – excellent alignment tool; and,
(3) Chromas LITE.
b) Reanalysis: The 3130xl’s Sequencing Analysis Software can sometimes improve your results; however, such analyses are performed only after a specific request. Use Sequence Scanner to determine which sequences are worth having reanalyzed.
Why analyze data with Sequence Scanner?
For the purpose of answering your research questions, you may analyze your electropherograms with any software of your choosing. In fact, many other programs are superior to Sequence Scanner in terms of manipulating sequence data. However, few – if any – can match Sequence Scanner (freeware) for investigating the quality of your sequence data and for helping to trouble-shoot sequencing problems. Go to 'Links' to download Sequence Scanner or other DNA analysis software.ABI recommends that data resulting from
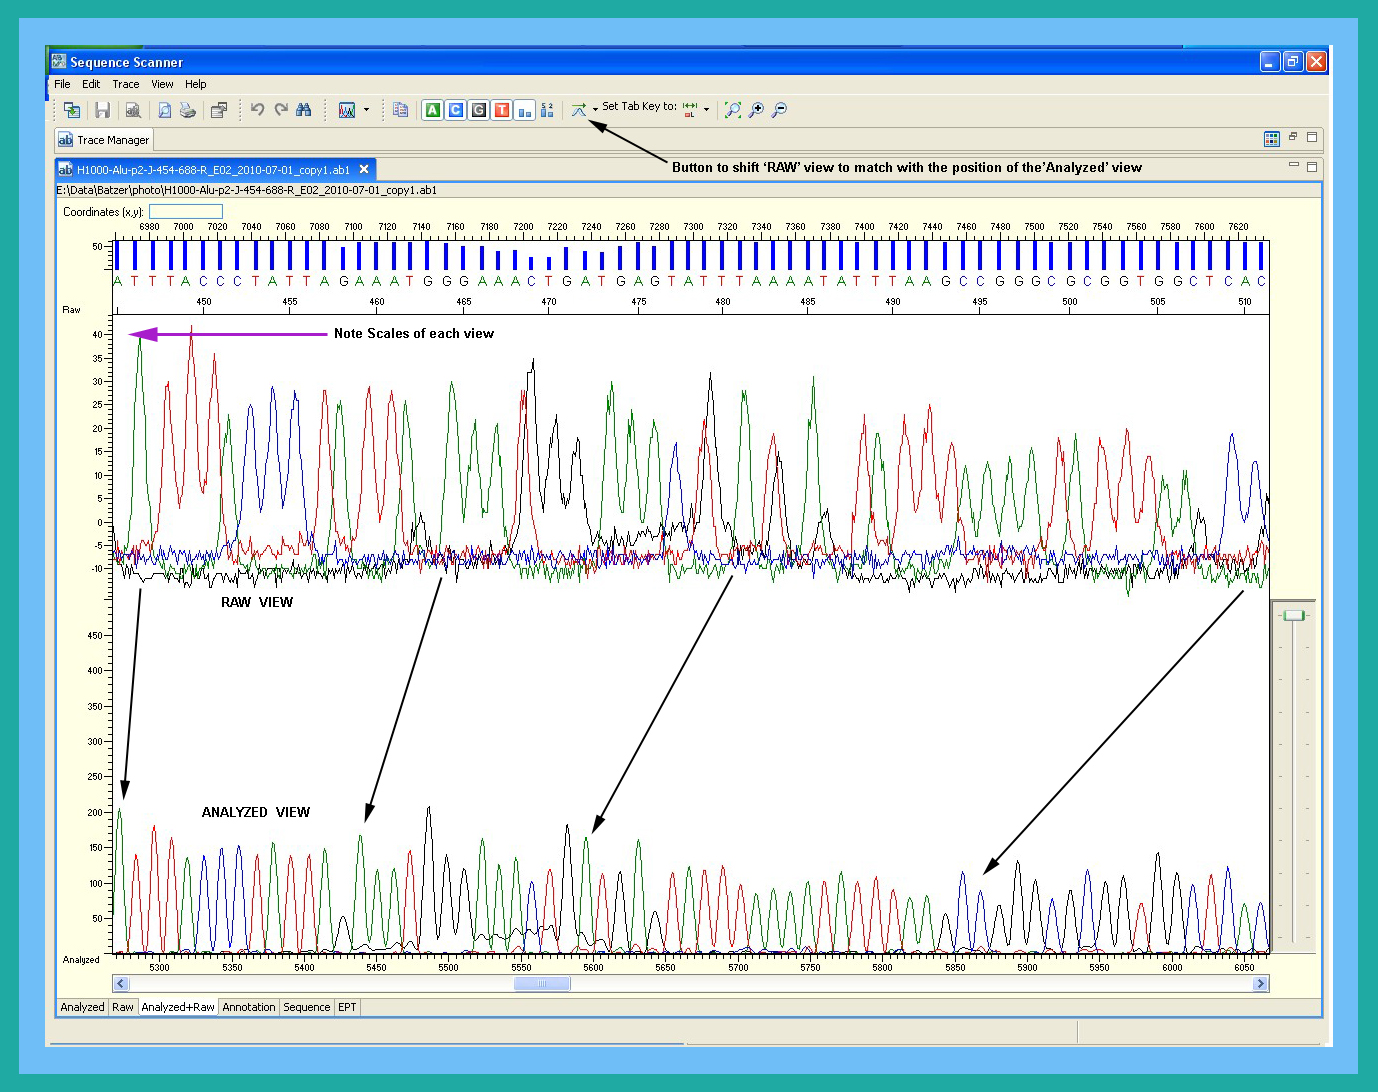
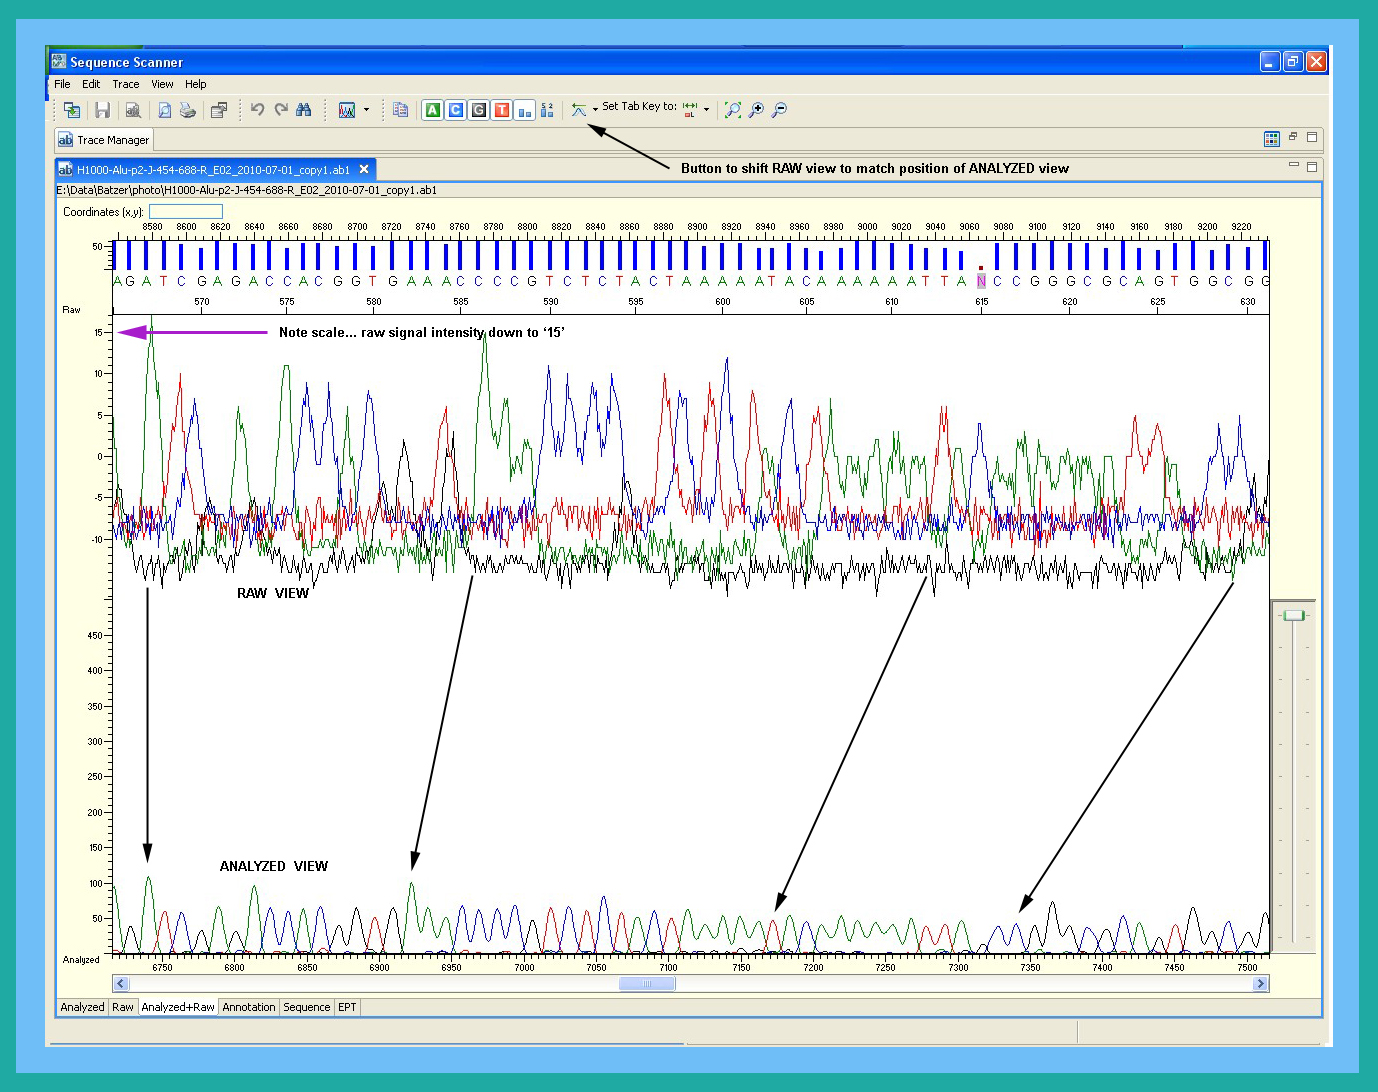
- Windows: i) Analyzed: electropherogram with base-call quality bars.
- Signal strength: When looking at a sequence trace in the 'Raw' window, you should be cautious about relying on base calls made with signal strengths of <40-50 (even if you see strong blue quality bars in the 'Analyzed' window). In the 'Annotation' window, values of >40-50 for the signal-noise ratio will help ensure good basecalls; use caution if values are <20, and be extremely cautious when values drop to ~10. However, because the 'annotated' values are scaled, please note that the displayed values in each window begin to diverge as actual signal strength rises above the minimum desired threshold.
- Reports: Sequence Scanner provides seven report formats that can be very useful in trouble-shooting your sequencing results. In particular, viewing the 'plate report' can identify situations in which poor sequence was due to a bad capillary on the 3130xl rather than to your sample.
ii) Raw: actual raw signal in compressed format.
iii) Analyzed + Raw: simultaneous view at same scale so that you can see what contributed to the final analysis in difficult base-calling conditions. As the sequence quality degrades, the Raw view and the Analyzed view begin to diverge; use the toolbar button (icon = 2 peaks, topped by an arrow) to shift the Raw view appropriately to match it up with the Analyzed view.
iv) Annotation: trace id, average signal intensities, analysis, consumables, instrument & software, and run configuration.
v) Sequence: text file with color coding for quality of base calls.
vi) EPT: graphic of actual electrical conditions during the run.
Why reanalyze my data with Sequencing Analysis v5.2?
Examine the raw view of your sequences in 'Sequence Scanner'. If there is a massive peak near the beginning of the sequence, you may wish to ask for a reanalysis. The software on the 3130xl can be used to excise that portion of the data from the analysis, which sometimes improves the base calls following the massive peak.Suppose I believe my bad data is the Core's fault?
If you believe that the Core made a mistake, please discuss your concerns with us. If it seems likely that a Core error might have occurred, we will work out a suitable response. However, please note that the Genomics Core is the sole arbiter regarding sample re-processing or other adjustments.Troubleshooting
Why did signal intensity soar, then plummet (at ~150 bp)?
If your samples are resuspended in formamide and the average signal intensity is >1000 (in the ‘Annotation’ window of Sequence Scanner), then you likely used an excessive amount of DNA template in the sequencing reaction. See How much DNA to use in a sequencing reaction? for further information.Why did the baselines separate (raw signal view)?
There are several possibilities according to ABI. However, a major culprit is degradation of the dye chemistry... most likely due to multiple freeze-thaw cycles. See Why aliquot original tube of BigDye Terminator mix v3.1? for further details.What causes a low-level signal after the PCR-stop?
There are at least four possibilities.1) You may have a second PCR product present at a much lower level than the primary product.
2) You might have some trace genomic DNA present in the sequencing reaction.
 3) If you reuse your sequencing plates by rinsing out the plates, there might be
some residual sequencing reaction from previous runs. In this case, you are likely to
notice multiple, distinct PCR-stops (artificially inserted by Taq polymerase). These
'stops' are usually indicated by an 'A' (which generally has 2+ the signal strength
of the preceding bases), followed by an immediate drop in signal strength of the remaining
sequence as seen in Rinsing_plates.jpg. Further,
the quality of the reads will vary along the length: (a) initially high (assuming good signal
strength for the current PCR product); (b) poor, following the PCR-stop of the current
sequence; and possibly (c) good (if the one of the prior PCR products was longer than all the
others and still retains sufficient signal strength.
3) If you reuse your sequencing plates by rinsing out the plates, there might be
some residual sequencing reaction from previous runs. In this case, you are likely to
notice multiple, distinct PCR-stops (artificially inserted by Taq polymerase). These
'stops' are usually indicated by an 'A' (which generally has 2+ the signal strength
of the preceding bases), followed by an immediate drop in signal strength of the remaining
sequence as seen in Rinsing_plates.jpg. Further,
the quality of the reads will vary along the length: (a) initially high (assuming good signal
strength for the current PCR product); (b) poor, following the PCR-stop of the current
sequence; and possibly (c) good (if the one of the prior PCR products was longer than all the
others and still retains sufficient signal strength.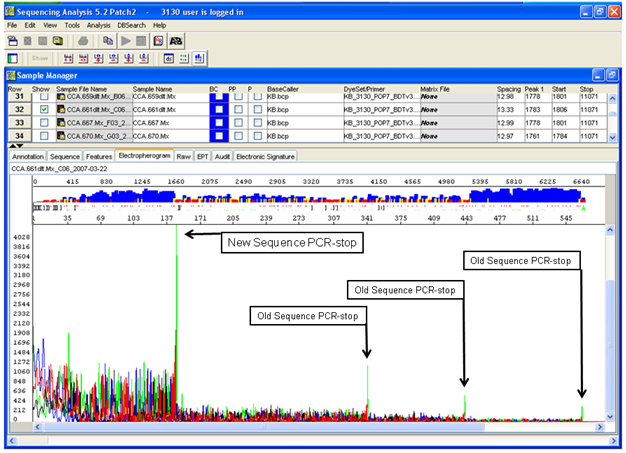
4) The basecalling software may be set to show all data, almost regardless of its quality. In this case, sometimes essentially random 'noise' will be translated into low quality peaks. While this can be annoying in that you must manually trim 'noise' from your sequence, the alternative is to allow the software to automatically trim low quality data. In that case, sometimes it will delete relevant data. This option can also adversely affect the Client's ability to use the sequence data with other software, such as Phred.
Why does signal intensity differ between capillaries on an array or different 3130xl’s?
Aside from varying results from your sequencing reactions themselves (which can occur for numerous reasons) or the cleanup, each capillary in the set of 16 allows different amounts of the fluorescent signal to pass through it. A good guide to the performance of an individual capillary is its peak height in a ‘spatial analysis’.If you are concerned that the signal strength of your samples may be very low, please state that in your ‘comments’ on the ‘Request Form’. If possible, the samples will then be run on the array currently having the best spatial peaks.
Why do massive peaks occur ~50-70 bp into my data?
If excessive amounts of unincorporated dye terminators remain in your samples after they have been cleaned, they will appear as massive peaks ~50-70 bp into your sequence data. When the levels are especially high, a secondary peak will occur ~50 bp farther downstream of the primary peak. For samples cleaned by EtOH-precipitation, this problem results from inadequate removal of the precipitation supernatant and the 70% EtOH used to 'wash' the precipitated sample. In the case of 'sephadex' cleanup, the sample either effectively bypassed the sephadex column (through cracks in the column or by being pipetted down the side of the well) or some of the sephadex passed through the plate membrane (most commonly in previously used plates). For further information, see How to clean sequenced templates?, EDTA vs. sodium acetate for DNA precipitation?, and 'Dump-&-Blot', pipette, or 'spin-out' ethanol?.Why did my sequence become 'trash' immediately after a pure poly-'singlebase' region?
Sufficiently long pure poly-'singlebase' regions (e.g., a poly-A tail) will result in at least two different signals immediately after the end of that region due to strand- slippage during PCR. When directly sequencing PCR products, such regions can be only ~8-10 bp long before they cause the rest of the sequence to be 'trash'. Up to 7 bp long, pure poly-'singlebase' regions do not pose any problem; between 8-10 bp long, such regions usually begin to degrade the subsequent sequence quality and may completely trash it; and, ≥11 bp long, such regions almost always result in a trashed sequence immediately after the region.If more than one pure poly-'singlebase' region exists in the sequence, each succeeding region more strongly affects sequence quality – such that even 5-7 bp pure poly-'singlebase' regions may have detrimental effects. By contrast, if there is even a single variant base in the middle of the otherwise 'pure' stretch (e.g., 'AAAAAAGAAAAAA') the quality of the sequence immediately following such 'nearly-pure' regions may be largely unaffected.
Our experiments have shown that the problem is due to strand-slippage during the original PCR, rather than during the sequencing reaction. First, for cloned products, much longer stretches are tolerated (perhaps as much as 35-50 bp). Second, when we performed PCR using cloned products as template, and then directly sequenced the PCR product, we saw the same results as when directly sequencing PCR products that used genomic DNA as template.
Fortunately, with the possible exception of a base or two, the length of the pure poly-'singlebase' region is preserved even when directly sequencing a PCR product. Thus, you have two solutions. Either clone the PCR product and sequence it. Or, sequence the PCR product in both directions, and join the contigs by matching up the regions of pure poly-'singlebase'.
Both approaches have their pros and cons, depending on your research goals and the number of problem regions. The PCR approach is massivly cheaper and faster; further, the results are just as accurate as from cloning – unless you are willing to sequence at least 6-8 clones (i.e., to achieve ~98% certainty that your clone represents the original sequence). On the other hand, if the exact length of the region is critical, if you have multiple problem regions in the same sequence, or if it is not possible to sequence from the other direction, then sequencing the cloned product is the better choice.
Why is the beginning of my sequence 'trash'?
The very first sequenced products are too small to resolve properly; thus, all sequences will have some 'trash' at the beginning – although the software usually cuts off most of that data. However, sometimes there will clearly be two (or more) distinct signals up to some point in the sequence, at which time all but one of the signals drops out and the remainder of the sequence is of high quality.Typically, you will notice that there is a very tall 'A' peak at the point where the signal(s) dropped out. Such peaks represent the terminus of a PCR product (most polymerases tack an 'A' onto the end of all sequences). If you are directly sequencing PCR products, then you have at least two PCR products in your reaction. Potential solutions are to gel-purify the correct PCR product, clone it, or fine-tune the PCR (primer design or cycling parameters) to eliminate the secondary product.
If you are working with cloned DNA, there are two primary possibilities. First, you might not have recognized that the colony was generated from two different bacteria (carrying different inserts in their vectors). To avoid errors through 'colony picking', see "Cloned DNA" under How to avoid multiple signals?.
Second, you might have a PCR product contaminating one or more of your reagents. If you suspect a PCR-contaminate, then determine which reagents are contaminated and get rid of them. Further, using aerosol-resistant – i.e., 'filter' – pipette tips greatly reduces the chances of this type of contamination.
Although they seem expensive (compared to bulk non-filter tips), you will likely save money in the long run and get data published sooner by using filter tips for any pipetting that involves sensitive activities such as transferring bacteria, setting up PCR, and extracting DNA. You can save some money by using regular tips for loading PCR products into gels – as long as you will not use the remaining PCR product for activities such as cloning or subsequent PCR.
Why am I suddenly getting poor quality Sequencing Reactions?
First, consider the possibility that your reactions were always on the edge of "not working", and check the raw signal levels of your previous "good quality" reactions; a good program for checking raw signal intensities can be found at Why analyze data with Sequence Scanner? If prior sequences were very weak, then the poor quality of your current sequences might be due to a very minor change somewhere in the overall workflow... but, the real issue is not that change, but rather the factor(s) that have always been resulting in low-signal intensities for your sequencing reactions.In the event that there really has been a significant change in your read quality, there are many possibile culprits. Some topics to consider are a change in reagents, a failing PCR machine, issues with reaction cleanup or the centrifuge used for cleaning sequencing reactions, or even a problem on the DNA Sequencer (e.g., an ABI 3130xl).
The most difficult troubleshooting involves a change in protocol or instrument parameters that seems completely innocuous. For example, you might always dry the cleaned sequencing reactions in a thermalcycler programmed with a series of 70oC holds (e.g., 5' each) and a final hold at 10oC; however, while you typically remove the samples prior to the final hold, you might sometimes leave the samples for some time at the low-temperature hold... which causes water to condense in the tubes (wells), leading to dye degradation. Unless you recognize that the poor quality results occur only when you leave the samples in the final hold, the appearance of low-quality reads will seem to be random. Similarly, consider whether these poor quality reactions were originally generated on a new or different thermalcycler (with respect to the one you normally use). If so, check the ramp rate on the thermalcycler; if the rate is much above 1oC/s, that might be the source of your sequencing problems; see What is the standard PCR sequencing protocol? and What is the maximum "Ramp Rate" for BigDye?.
Why did my samples show "delayed migration"?
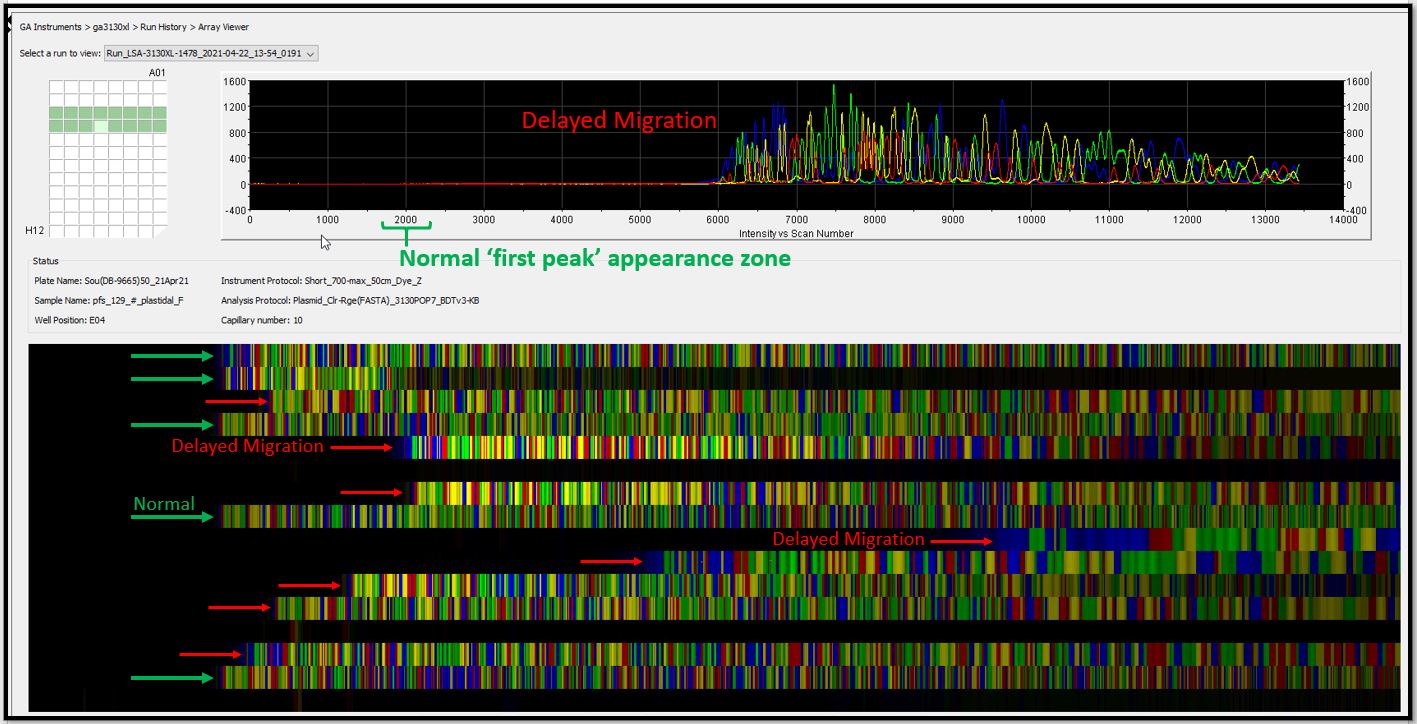
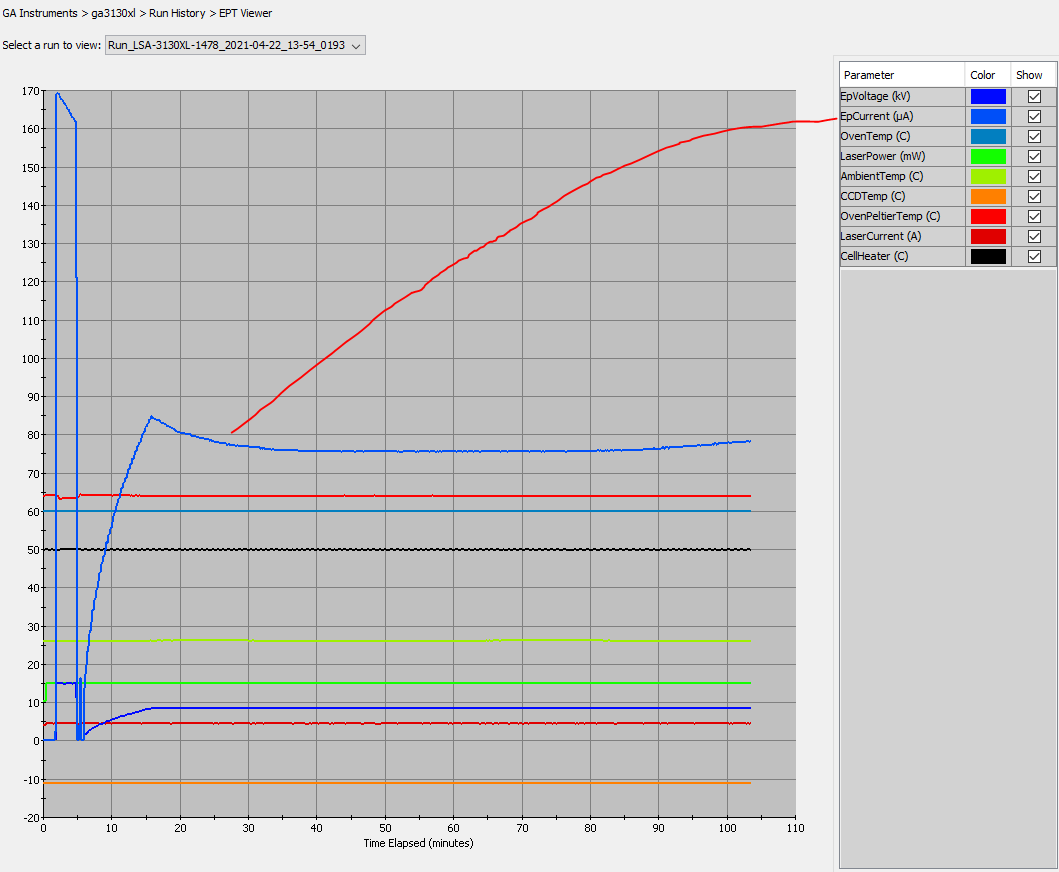
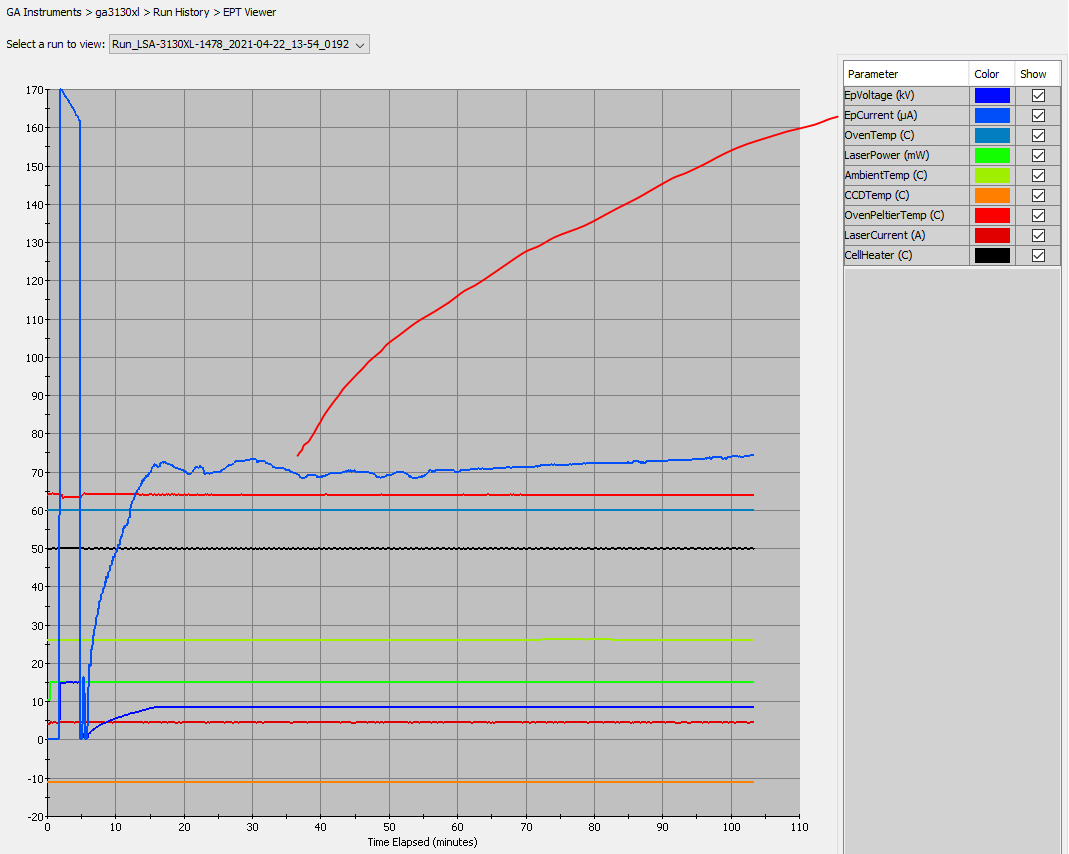
— the problem follows the sample if the run is repeated with samples going through the array in a different capillary order or even on another 3130xl altogether.
— a pattern is seen in which samples migrate normally if less template volume is used, but experience delayed migration when greater amounts of template are used... indicating that the cleanup method produces a contaminated template product, but at a low enough level that sequencing reactions are okay as long as minimal template volume is used in the sequencing reaction.
— upon re-running the same samples on the 3130xl, additional samples show delayed migration... presumably, this situation occurs when the contaminates need more time to resuspend in the HiDi formamide.
— sometimes, the problem has been traced to a client's specific kit which was either long-expired or simply "bad" (either from the factory or from mishandling in the lab)... and the soluton was to replace the kit.
— higher than normal salt levels might remain if larger than usual sample volumes are processed through a single column or if the column is too thoroughly dried out in the binding stage by longer centrifugation times... in which case, adjusting the protocol or perhaps adding an additional Wash step can eliminate the problem.
Why did my plasmid sequencing fail?
The most likely culprits are going to be issues such as grossly inaccurate DNA concentration estimates, primer issues (e.g., wrong primer, no primer, degraded primer), buffer components that inhibit the sequencing reaction (e.g., high levels of EDTA), and a plethora of potential user errors. However, on rare occasions, it turns out that strong secondary structure of intact plasmid DNA effectively shuts down sequencing reactions. In that case, the solution is to linearize the plasmid prior to sequencing with a restriction enzyme that will not cut in a problematic location with regard to the region needing to be sequenced. The linearized DNA should be cleaned and analyzed in a gel (for expected cut sizes and concentration estimates) prior to the sequencing attempt.Where can I find more trouble-shooting information?
Please see the following document:FA: Services & Comments
Services
As noted below, clients have two primary options with regard to Fragment Analysis submissions. For complete details, please see ABI 3130xl Genetic Analyzer services.— Submission Option #1: Typically, samples are submitted as completed reactions, including the addition of size standards.
— Submission Option #2: After consultation with Core staff, clients may submit raw PCR products (i.e., FA products) and request that the Core dilute/aliquot the FA products and add the size-standard to all wells. This option incurs additional reimbursement charges.
Overlap with DNA Sequencing SACK's
Much of the advice in the DNA Sequencing SACK's applies to samples for Fragment Analysis. Thus, for concerns not specifically addressed in these "FA" sections, please refer to the SACK's on DNA Sequencing.FA: Sample Preparation
HiDi Formamide
HiDi Formamide (Thermofisher Cat. No. 4311320) is required for both dilution of FA products and for the Size-Standard Master-mix.– Other formamides might not be properly buffered, which can lead to data degradation or even complete sample loss.
– Water is not recommended for dilutions of FA products because the combination of water + formamide generates formic acid ions, resulting in poor data quality. By diluting the original FA PCRs in HiDi formamide (vs. in water), very little water will remain in the samples that are processed on the 3130xl platform.
Sample preparation example
Determining the correct sample dilution, amount of diluted sample input, and the amount of size-standard is an interative process. The goal is to have sufficient, but not saturating, signal intensity from the samples with the size-standard peaks being 20-100% of the height of the sample peaks.– For an example of how to prepare reactions, please see 3130xl_FA_sample_preparation.xlsx. This document also contains information critcal for selecting the correct size-standard.
– As the size-standard is relatively expensive, most clients attempt to minimize the amount of size-standard required; thus, they strive for modest signal intensities from their samples and titrate the size-standard to ~30-50% of the sample peak heights.
– Before performing your reactions, verify with us that your dye set (DyeSets.docx) is compatible with our Spectral calibrations – if not, either you will need to use a different dye set or we will need to order a dye matrix calibration kit to generate the required Spectral.
FA: Troubleshooting
Please see the following document:
The Dark Side
How stringently should I follow written protocols?
Always... sometimes... or, perhaps, not at all. There is a little recognized 'dark side' to the methods section found in nearly all scientific papers – as well as elsewhere, such as in this 'Science Aid Center'. Namely, once a procedure is engraved in the literature, many of us treat it as having been written on stone tablets... as though it were something akin to Moses handing us the 'Ten Commandments'. We generally fail to analyze the published methods to determine whether particular aspects are likely to be necessary, despite knowing that most authors are simply repeating what they were taught or what they read in a prior article.That is, the methods they used were never subjected to controlled experiments to determine the best way to accomplish a particular goal. Instead, once a procedure worked well enough to produce something akin to the desired result, experimentation on the protocol stopped, the process was recorded in terms of what was done in the last iteration, and another suboptimal procedure was born. A critical point here is that these procedures typically include details that were irrelevant – given that the author had no way of knowing if those details were critical or not. In fact, it is not unusual to find that some aspects of the procedure adversely affect the outcome.
Thus, unless you know better, you should always follow the written procedure – after all, it did work, even if suboptimally. But, if you have some knowledge of how things actually work, you should sometimes deviate from those procedures. And, if you really know how things work or you are willing to experiment (GASP!), you should treat the written procedure as a guideline only and forge your own way. You just might make the next great discovery and change how 'science' is done. That being said, for samples being submitted to our Core, please do
RNA & DNA extraction
Phase Lock Gel tubes
By traditional means, organic extractions of nucleic acids are plagued by the difficulty of pulling off the upper organic fraction while simultaneously avoiding the protein-interface with the aqueous layer. As described in the 5PRIME Phase Lock Gel protocol, PLG tubes greatly simplify organic extractions of either RNA or DNA while also increasing yields and purity. This product has been sold under several different corporate logos, but it is currently sold by Quantabio or through VWR (2021). Of course, if you wish to expend the effort, you can essentially duplicate this product using DOW Corning high vacuum grease and your own tubes.Gel electrophoresis
TBE buffer: '1X' versus '0.5X'?
Originally, 1X TBE was recommended for DNA electrophoresis (agarose gels). However, if you use 0.5X TBE, you can run gels either 2X as fast (i.e., at 2X the voltage) or 2X as cool (i.e., at the same voltage); yet, the ions are still sufficiently concentrated to allow for multiple gel runs without recirculation of the tray buffer.Thus, the benefits of 0.5X TBE come in two flavors: (a) reduced run times; or, (b) better separation and straighter bands. Of course, you can mix the flavors by choosing an 'in-between' voltage.That being said, a better choice for DNA gel electrophoresis is Sodium Borate (see Buffers: 'Sodium Borate' versus TBE?).
Buffers: 'Sodium Borate' versus TBE (or TAE)?
As discussed above in How stringently should I follow
written protocols?, suboptimal protocols can become enshrined in the scientific
literature. In this case, the science of DNA analysis followed that of protein
analysis; thus, DNA experimental methods were adapted from those of the 'protein era'.
Not unexpectedly, the basic techniques of protein electrophoresis were at least
suitable to DNA electrophoresis – and that's where progress stopped for a
long time in that field.
In 2004, Brody and Kern published two articles describing their efforts to improve
on the long-standing kings of DNA electrophoresis buffers – TBE and TAE. They
showed that sodium borate actually was a superior solution for DNA electrophoresis,
in that it allowed gels to be run far faster and cooler while producing straighter
and better-resolved bands. Further, sodium borate did not pose any problems for
cloning DNA from gel slices.
In my personal experience with sodium borate, I have found that it even allows much
greater amounts of DNA to be electrophoresed without overloading the gel; it also
allows for much higher sample throughputs in the same number of gels. I could run
25-cm agarose gels (2%, 600 V) for 7 minutes and resolve 200-700 bp bands sufficiently
to suit my needs. Nevertheless, from a practical standpoint, I actually used 325 V (25 min)
because, by the time I finished loading a fourth 104-well gel, the first gel was completed.
To see some of the benefits of using sodium borate, please download a short (~1.7 Mb)
Powerpoint presentation: Sodium_Borate_vs_TBE.pptx.
Sources for Sodium Borate (SB):
1) Faster Better Media LLC: Brody & Kern
have established a company which supplies pre-made sodium borate. In addition, they have developed
other electrophoretic solutions (e.g., lithium borate and lithium acetate) which may be more suitable
for your needs.
2)
20X solution (prepared in a 1 liter heat-resistant bottle):
800 ml of Nanopure water (
8 g of NaOH (40 M.W.); and,
36.76 g of H3BO3 (61.83 M.W.).
It is extremely difficult to dissolve the borate without getting the solution very hot;
thus, stir the solution over high heat until all the powder has fully dissolved. Then,
remove the stir bar, allow the solution to cool to room temperature, and bring the
volume to exactly 1000 ml in a graduated cylinder. Return solution to the heat-resistant
bottle and check the pH; if you added the ingredients correctly, you should get ~pH 8.5
for the room temperature solution.
Frankly, given that it is rather difficult to accurately determine the pH of this type of solution, we skip the 'pH' step. Besides, it is
Finally, as with TBE,
you should try to use the same working stock of sodium borate for making your gels
and electrophoresis buffer. However, using different working stocks does not usually
cause a problem for routine electrophoresis.
Dilutions:
Working stocks: Unlike for TBE, you should use 1X sodium borate for electrophoresis. At 0.5X,
the quality of your gel results will be substantially degraded. Nevertheless, at 1X, you can reuse
sodium borate gels and buffer the same as with TBE.
Small batches: If you will be using the solution to prepare small batches of working
strength 'buffer', do not make the stock solution stronger than 20X, so that you won't have to be so precise in your
measurements. This will allow you to use (for 1 liter of 1X solution) 50 ml of 20X stock and
950 ml of nanopure water – versus 25 ml of 40X stock and 975 ml water.
Large batches: To prepare 40 liters of a 1X solution, simply dilute one liter of a
40X stock with 39 liters of nanopure water. For other volumes, it would be best to adjust the
strength of the stock solution accordingly (e.g., 30X for 30 liters of 1X stock).
Source Publications:
1) Sodium boric acid: a Tris-free, cooler conductive medium for DNA electrophoresis.
Jonathan R. Brody and Scott E. Kern. BioTechniques 36:214-216 (February 2004).
2) History and principles of conductive media for standard DNA electrophoresis.
Jonathan R. Brody and Scott E. Kern. Analytical Biochemistry 333 (2004) 1-13 (Review).
Can I reuse my agarose gels and electrophoresis buffer?
Yes ... and... No.If you are trying to gel-purifiy a fragment, you should always use fresh electrophoresis buffer and a freshly-made gel. Otherwise, you can reuse both the gel and the electrophoresis buffer – until they become too 'dirty' for your purposes.
You can maximize the number of times these items can be reused by taking precautions to keep them clean. For instance, always place gels on clean surfaces and use only Kimwipes – not paper towels, which leave behind lint – to clean any surfaces that the gels touch. Further, if your gels are stained with ethidium bromide (EtBr), protect your stored gels from light as it degrades the fluorescent capabilities of the EtBr (
The EtBr content of your reused gels will decrease with each run as some of the EtBr will migrate out of the gel. It is possible to add EtBr to the gel upon remelting it; however, ensure that you add only a small fraction of the amount initially added to the gel – or the gel itself will fluoresce so brightly that your bands will disappear. Until you become proficient at this process, you should check the prepared gel's suitability on a UV-lightbox prior to running samples in it.
qPCR
qPCR instrument block type?
A seemingly obvious, but sometimes overlooked, aspect of qPCR is the type of block in the qPCR instrument. Clearly, you cannot run a 96-well plate in a 384-well block; however, what about the "fast" vs. "standard" 96-well blocks? Plates for these two block types differ in terms of both their well volumes/depths and wall thicknesses; thus, you must use "fast" plates in "fast" blocks and "standard" plates in "standard" blocks. Otherwise, the true qPCR cycling parameters will not match the expected parameters.Choice of qPCR plates and seals?
Each qPCR platform is calibrated using a specific pairing of optical 96-well reaction plates and optical seals. This fact is especially critical with respect to the Background Calibration. Other plates and seals might have different fluorescent properties or be more or less transparent to emissions from the instrument's thermal block. An extreme example would be white plates that will block all emissions from the block, which clearly will not match the original Background Calibration done with any non-white plate.Thus, if you choose to use "plastics" that differ from those used during instrument calibrations, best practice is to first run at least one test plate in which all 96-wells contain just nuclease-free water. This will help you to determine if your plates and seals are suitable, even though the qPCR platforms were not actually calibrated with your "plastics".
“Cradle-to-Grave” plate protection
All qPCR platesSuch contamination can be transferred to the block of the qPCR machine, adversely affecting your experiment and subsequent experiments until the block contamination is discovered and laboriously removed.
Thus, your new plate
Cold-Reaction Setup
In many cases, it is no longer necessary to set up qPCR under "cold conditions". However, if you do so, please note that ice may be contaminated even when visibly clean (as is evident upon melting a bucketful from typical ice machines).Thus, for "cold-reaction" setup, best practice is to use a dedicated metal block (chilled) for 96-well PCR-plates or a dedicated insulated container filled with clean ceramic or glass beads. If reactions are set up on ice, the plate must be centrifuged either immediately after being removed from the ice or after being briefly soaked in clean water.
Finally, prolonged setup times with a chilled plate can result in atmospheric water condensing in the wells, thereby altering reaction volumes and ultimately your results. This problem can be severe under high humidity conditions (e.g., building A/C is not at normal capacity). One option is to cover the plate with a "cap" whenever not actively pipetting into the plate.
Applying Optical Adhesive Seals
Applying optical seals is not difficult; however, improper sealing technique can lead to evaporation from wells. For a primer on this topic, review ThermoFisher's YouTube video for proper Sealing Technique. (Caveat: Although the video voice-over states "between each well and along outside edges", please note that the demonstrator doesIt is also important to avoid touching the surface of the adhesive film as oils and other substances could affect its optical qualities or even fluoresce. Similarly, your applicator paddle must be clean. However, ethanol has its own fluorescent properties; thus, if you remove potential oils with ethanol, you need to thoroughly rinse the paddle with purified water and dry it with a Kimwipe.
Finally, it is critical that you do not leave any sticky residue on the plate after removing the 'wings' from the adhesive film. Such residue can cause the plate to bond with the heated cover plate, making it difficult for the instrument to disengage from the plate.
Ethanol preparation & storage
Relevance of "Miscibility" & "Packing"?
Miscibile: If two substances can combine to form a homogenous solution without generating precipitates, they are "miscibile". The Solvent Miscibility Chart provides a handy reference for determining miscibility for a large number of liquids commonly used in biological sciences.
Packing: Most of the time, the volume of a mixture of two different miscibile liquids will be less than the sum of their individual volumes. The underlying physics involved is complicated, but... to put it simply, the molecules of two mixed liquids can pack together more efficiently than they could separately.
The combination of these two issues means that mixtures of miscibile liquids should be prepared by separately measuring the volumes of the two liquids... and then combining them. Otherwise, the percentages of each liquid in the mixture will not be correct.
Why not "top off" to make 70% Ethanol?
For simplicity, one can make 70% EtOH by 'topping off'... that is, by pouring EtOH into a 50-ml tube up to the 35-ml mark, and then slowly pouring in nuclease-free water up to the 50-ml mark. However, due to both 'pouring errors' and 'miscibility issues' (see Relevance of "Miscibility" & "Packing"?), the actual percentage of ethanol is unlikely to be 70%.In some applications, the exact percentage of ethanol is not especially critical (e.g., performing a 'wash' of EtOH-precipitated Sanger-Sequencing products). However, in other applications, even small deviations from the specified EtOH percentage can be problematic (e.g., nucleic acid purifications by Agencourt AMPure beads).
Thus, when the exact percentage of EtOH is critical, the ethanol and the water should be measured separately and then combined.
How to minimize effects of humidity on Ethanol?
Ethanol is highly hygroscopic; as such, whenever ethanol is exposed to a humidified atmosphere, it will absorb water. Thus, ethanol solutions should be opened as briefly as possible... and whenever not in immediate use, they should be very tightly capped. However, once the manufacturer's seal has been broken, ethanol should not be stored long-term on the bench because even tightly-capped ethanol will gradually absorb moisture from the air.Instead, to minimize absorption of water from the atmosphere, ethanol solutions should be stored in low-humidity environments... such as a refrigerator or freezer. The one caveat here is that one must either let chilled ethanol warm to room temperature before opening the tube or else leave the cap off only very briefly. Otherwise, moisture in the air will rapidly condense on the surface of the cold ethanol.
Do I need to use Ethanol "cold"?
When molecular biologists first began extracting and precipitating DNA, 'cold' ethanol was typically specified and many protocols called for overnight storage at -20oC and centrifugation at 4oC. However, with the possible exception of extractions/precipitations involving minute quantities of DNA, 'cold' is not necessary and can even be detrimental to yields (e.g., due to increased viscosity of the precipitation solution during centrifugation). Nevertheless, as discussed above in How stringently should I follow written protocols?, these suboptimal protocols are enshrined in the scientific literature.On the other hand, as discussed in How to minimize effects of humidity on Ethanol? it can be helpful to store ethanol solutions in refrigerators and freezers. For further details on DNA precipitation, please see How to clean DNA templates for sequencing?
Do I need to make fresh 70% Ethanol daily?
Ethanol is highly hygroscopic; as such, whenever ethanol is exposed to a humidified atmosphere, it will absorb water. Thus, even when carefully stored, the percentage of ethanol in a container will decrease over time... although the rate of decrease will depend greatly on how the solution is handled and stored. For applications in which the exact percentage of ethanol is critical, it is best to make your 70% EtOH daily.Nanodrop (DNA & Protein)
Nanodrop Guide for Nucleic Acids
The Nanodrop Nucleic Acid Guide (pdf) provides nucleic acid measurement support information relevant to Thermo Scientific NanoDrop 2000/2000c, 8000 and 1000 spectrophotometers. Please refer to the model-specific user manual for more detailed instrument and software feature-related information.The patented NanoDrop™ sample retention system employs surface tension to hold 0.5 μL to 2 μL samples in place between two optical fibers. Using this technology, NanoDrop spectrophotometers have the capability to measure samples between 50 and 200 times more concentrated than samples measured using a standard 1 cm cuvette.
Nanodrop Guide for Protein
The Nanodrop Protein Guide (pdf) is meant to provide some basic protein measurement support information for direct A280 methods relevant to Thermo Scientific NanoDrop 2000/2000c, 8000 and 1000 spectrophotometers. Please refer to the model-specific user manual for more detailed instrument and software feature related information.The patented NanoDrop™ sample retention system employs surface tension to hold 0.5 μL to 2 μL samples in place between two optical fibers. Using this technology, NanoDrop spectrophotometers have the capability to measure samples between 50 and 200 times more concentrated than samples measured using a standard 1 cm cuvette. The Protein A280 method is applicable to purified proteins that contain Trp, Tyr residues or Cys-Cys disulphide bonds and exhibit absorbance at 280 nm. This method does not require generation of a standard curve and is ready for protein sample quantitation at software startup. Colorimetric assays such as BCA, Pierce 660 nm, Bradford, and Lowry require standard curves and are more commonly used for uncharacterized protein solutions and cell lysates.
Epic Nanodrop Fail (ouch!)
A common refrain after failed sequencing reactions is "But the Nanodrop showed plenty of template!" For a review of one amazing example and the accompanying analysis, please see Epic Nanodrop Fail (pdf).NanoDrop Quick Tips
NanoDrop Quick Tips
As absorbance measurements will measureBioanalyzer DNA-HS Chip
Mastering the Bioanalyzer DNA-HS Chip assay
The combination of Agilent’s Bioanalyzer and the DNA High Sensitivity Chip is a useful tool in the QC of NGS libraries. However, as seen in forums such as the former Ion Community, many facilities have had frustrating experiences with the DNA HS chip... particularly with the issue of “delayed migration”.Initially, I experienced many of the same frustrations. However, since 2011, I have often worked closely with Agilent Technical Support and R&D to resolve various issues, including ones about which Agilent was unaware existed (e.g., incompatibility of raw E-gel samples and the DNA-HS chip).
As a result, nearly all of my DNA High Sensitivity chips have been successful since mid-2014. To share that success, I have distilled my experience with this assay into Mastering the Bioanalyzer DNA High Sensitivity Chip assay (docx), which includes a vital explanation of the architecture of the DNA-HS chip (also see Loading Agilent Bioanalyzer chips... Genomics Core style!). However, readers should note the following:
- Although this document shares ideas that I consider essential to my mastery of the DNA HS chip for the QC of NGS libraries, it should not be regarded as a “manual”.
- The goal here is to focus on issues not highlighted by the Quick-Start Guides included with the kit; thus, readers should also refer to those guides (or the full documentation).
- Finally, the linked documents in the Bioanalyzer “Help” tab contain a wealth of useful trouble-shooting information and tips on how to operate the instrument and software.
![Chip architecture [courtesy of Agilent]](images/genomics/agilent-bioanalyzer-dna-hs-chip-architecture.png)
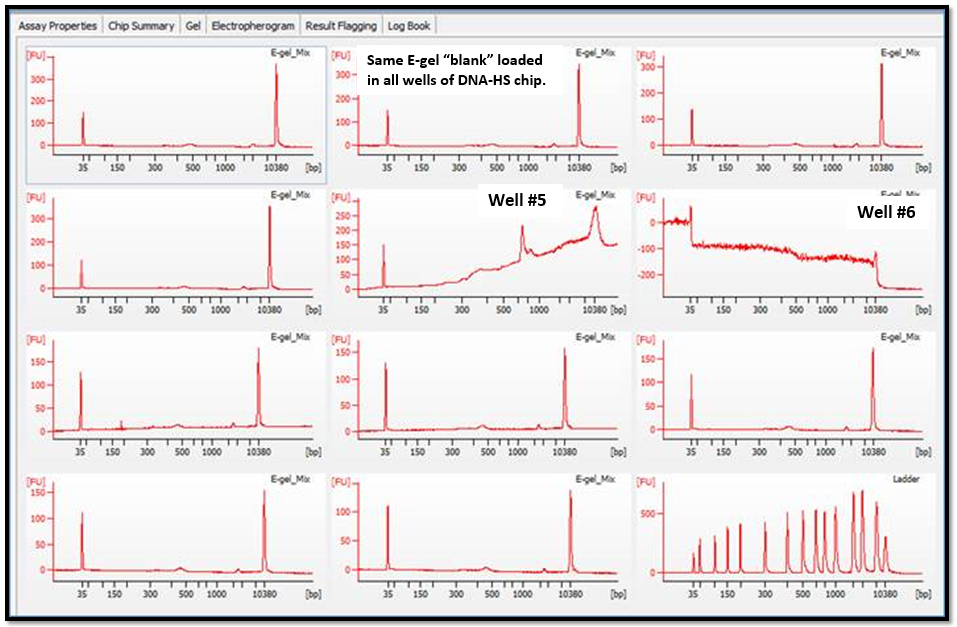
Loading Agilent Bioanalyzer chips... Genomics Core style!
This information was first posted on LinkedIn, by Scott Herke; that post also contains an image showing results from a chip that was processed with the revisions noted below. These updates (to Mastering the Bioanalyzer DNA-HS Chip assay) simplify the process and further ensure high quality results. The following brief comments highlight the changes in my revised protocol, Mastering the Bioanalyzer DNA-HS assay (June-2025).docx.Samples: Traditionally, clients submit an absolute minimum of 2-µl of each sample (1-µl for the chip + 1-µl to allow for accurate pipetting by the Core staff). However, they can submit a single microliter per sample (or replicate sample), if the Core adds the Marker Solution (5-µl) directly to the sample tube... and then pipettes the entire volume into the Bioanalyzer chip. This saves sample volume for the client. Further, it simplifies and speeds chip loading by pre-loading the Marker Solution with the sample, allowing the staff to pipette only one volume into the actual chip.
Prepared Gel mixes: Even during the recommended 6-week window for prepared gel mixes, some particulates might form in the gel while stored in the refrigerator... and such particulates can adversely affect the assay. Thus, before warming a previously-prepared gel mix for a new chip run, I centrifuge the tube at ~2,450 rcf (5 min, room temperature) to pellet any such particles. Further, when pipetting, I avoid coming too close to the bottom of the tube. Finally, if multiple chips will be run on the same day, I leave the gel at room temperature (~20oC) until all runs have been completed; over the recommended 6-week lifetime for prepared gel, I have not seen any problems from leaving the gel at room temperature (but, protected from light) for several hours.
Centrifuging chips: I have found that even very careful loading technique can leave small droplets on the sidewalls of the chip wells. These droplets are not necessarily visible to the naked eye, but careful examination of the chip from various angles with a magnifying glass will reveal the droplets. Such droplets can cause a major chip malfunction or simply degrade sample results. A simple solution is to briefly (30 s) and lightly (100 rcf) centrifuge the chip in a plate centrifuge. To hold the chip securely during centrifugation, I cut a piece of heavy-duty cardboard to shape so that it fits in the rotor bucket and the chip fits tightly in the cardboard 'plate' (see Cardboard Chip holders); more recently, these holders were generated by 3-D printing (see 3-D printed Chip holders). It is, of course, necessary to avoid touching the glass under the wells during this extra step.
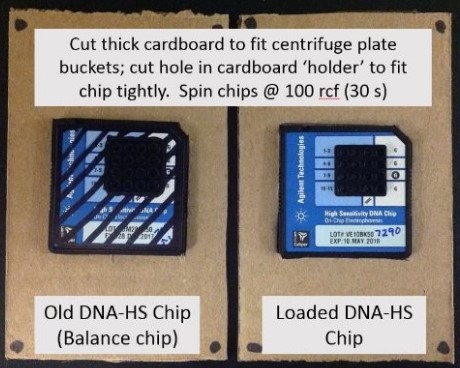
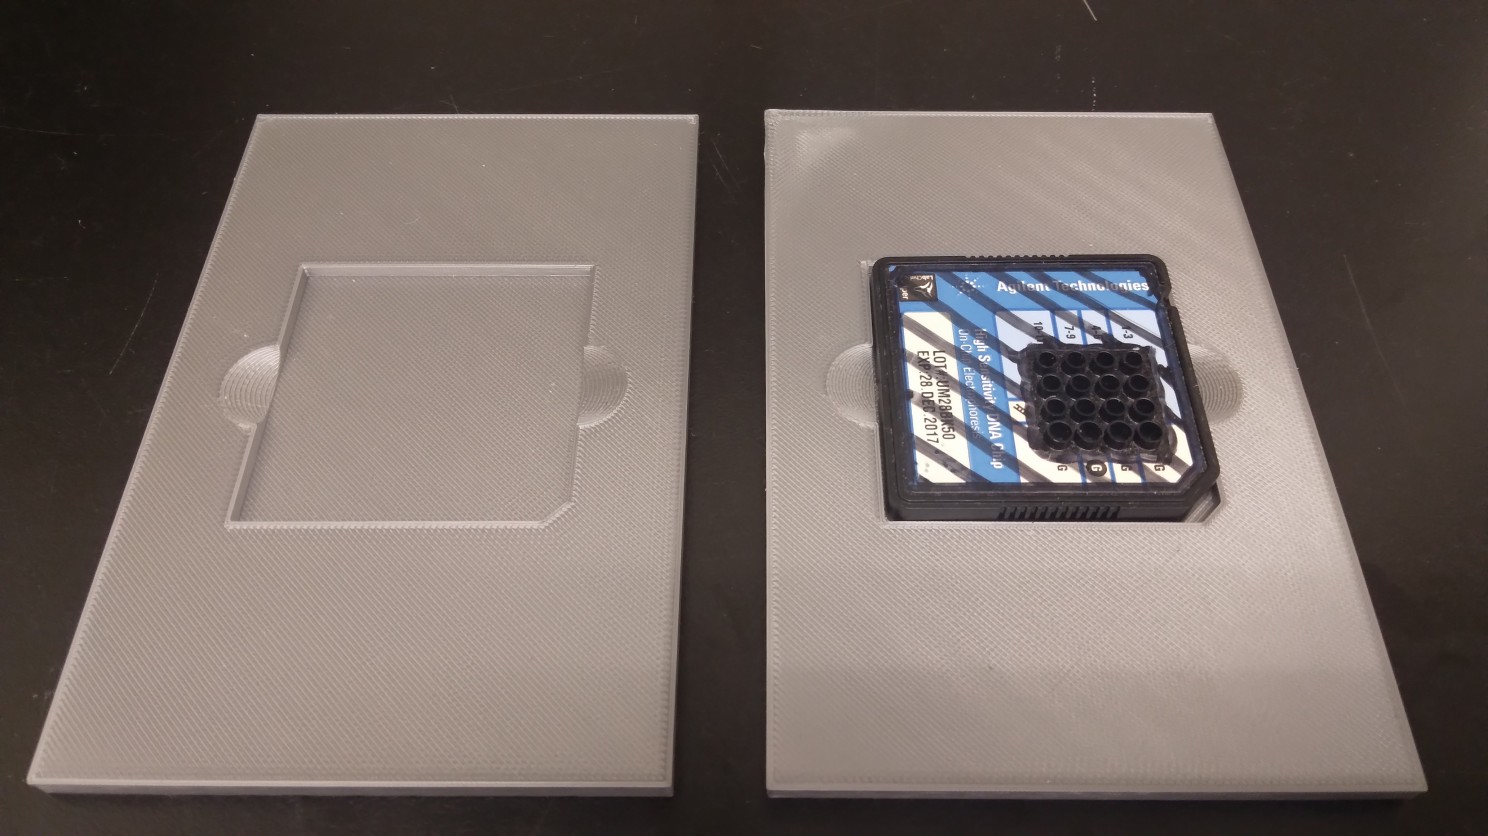
Bioanalyzer RNA Pico 6000 Chip
Tips for preparing and loading RNA Pico 6000 chips (Agilent Bioanalyzer)
This information was first posted on LinkedIn, by Scott Herke; that post also contains an image showing results from a chip that was processed with the revisions noted below.First, I am pleased to report that the comments in those two prior articles are directly applicable to the RNA Pico 6000 chip. For instance, the layout of the microfluidic channels is identical for both chip types; thus, here too, contaminates from samples in particular wells may affect results for other wells... and users may want to implement a ‘triage’ strategy for where particular samples are loaded in a chip (see Mastering the Bioanalyzer DNA-HS Chip assay. Further, the RNA Pico 6000 chip benefits from my recommendations in Loading Agilent Bioanalyzer chips... Genomics Core style! for simplifying the workflow and saving sample volume (by pre-mixing 1-ul samples with marker solution) as well as for improving the consistency of results (by gel handling techniques; centrifuging loaded chips).
Second, I confess that I originally found it difficult to maintain good results from chip-to-chip with the RNA Pico 6000 assay. In large part, I believe that difficulty stemmed from thinking I could process submitted RNA samples in the same way that I treated samples submitted by clients for the DNA-HS assay. Here, I report a system (detailed in Agilent_RNA_Pico_6000.docx) that enables me to generate good results with this RNA-Pico assay on a consistent basis... although I must point out that I have not tried to determine if all of the steps are essential... and that sometimes I am simply now following the official protocol.
- RNAse-ZAP: Clean all assay work areas with RNAse-ZAP prior to working with the samples and the chips. I spray RNAse-ZAP across the work areas and wipe them dry with large Kim-Wipes. I also wipe down instruments, racks, pipettes, pipette boxes, and centrifuge rotors... although care must be taken to avoid introducing the RNAse-ZAP into any areas that will come into contact with the sample (e.g., the electrode pins of the Bioanalyzer).
- Electrode pins: Use a pin set that is dedicated for RNA assays. Also, prior to use, rinse (with RNAse-free water) the pins 4X (5’ each) in a dedicated RNA-Water cleaning chip; leave lid open (5’) to dry the pins prior to running the assay.
- Ladder preparation: Follow the official protocol regarding denaturation of the Ladder and dilution of the denatured ladder (10-ul); then, aliquot the ladder into ~30 Lo-Bind Eppendorf tubes (3-ul each) for storage at -70oC. Note: Ladder concentration is critical to the assay because the area under the ladder curve is used to estimate RNA concentrations.
- Ladder/Sample denaturation: As per the official protocol, I do not denature the ladder once it has been diluted and I keep the thawed ladder aliquot cool until used. As for samples, I avoid heat-denaturing them because it usually isn’t necessary and I have found that the process can sometimes cause RNA degradation.
- Sample buffer: This assay is extremely sensitive to salt composition and concentration. For instance, even 10 mM Tris can significantly reduce the signal intensity generated by the samples and Lower Marker (LM). Thus, I pay attention to the relative height of the LM in samples compared to its height in the Ladder well; if sample LM peaks are substantially lower, that indicates that the sample buffer might reduce the quality of the chip results. (Note: The LM is composed of DNA, not RNA.)